
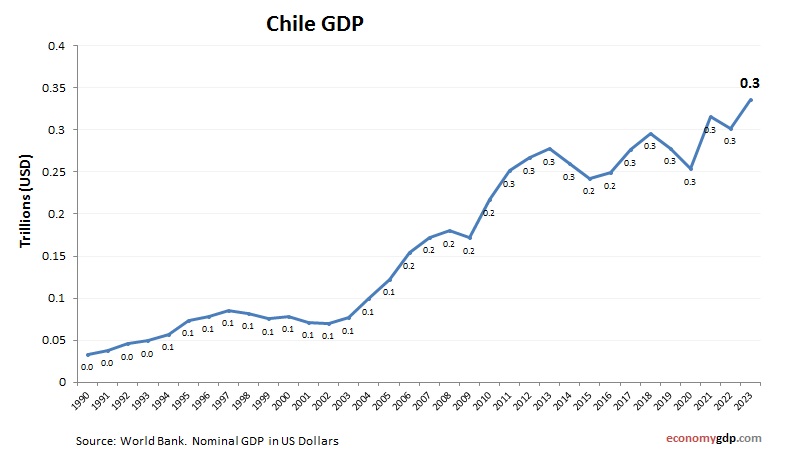
Chile GDP from 2010 to today. World Bank and OECD data. GDP in US dollars. Chile's $330 billion economy, growing 2.4% in 2025, excels in copper, wine, and salmon exports, with per capita GDP at $17,000. Copper dominates trade, while machinery imports support industry for its 19 million people. Inequality and earthquake risks challenge progress. Recent lithium investments and renewable energy projects drive sustainability, targeting carbon neutrality by 2050. Chile focuses on green technology and education to reduce poverty, leveraging its Andean resources. Investments in infrastructure and social programs enhance resilience, positioning it as a South American leader. Navigating global commodity shifts and environmental concerns, Chile aims for inclusive, innovative growth with a strong economic foundation.
Chile GDP Statistics by Year
| Year | GDP Size (in billions $) |
| 2025 (projected) | 338 |
| 2024 | 330 |
| 2023 | 336 |
| 2022 | 301 |
| 2021 | 315 |
| 2020 | 254 |
| 2019 | 278 |
| 2018 | 296 |
| 2017 | 276 |
| 2016 | 249 |
| 2015 | 242 |
| 2014 | 260 |
| 2013 | 277 |
| 2012 | 267 |
| 2011 | 251 |
| 2010 | 217 |