Burundi GDP per capita
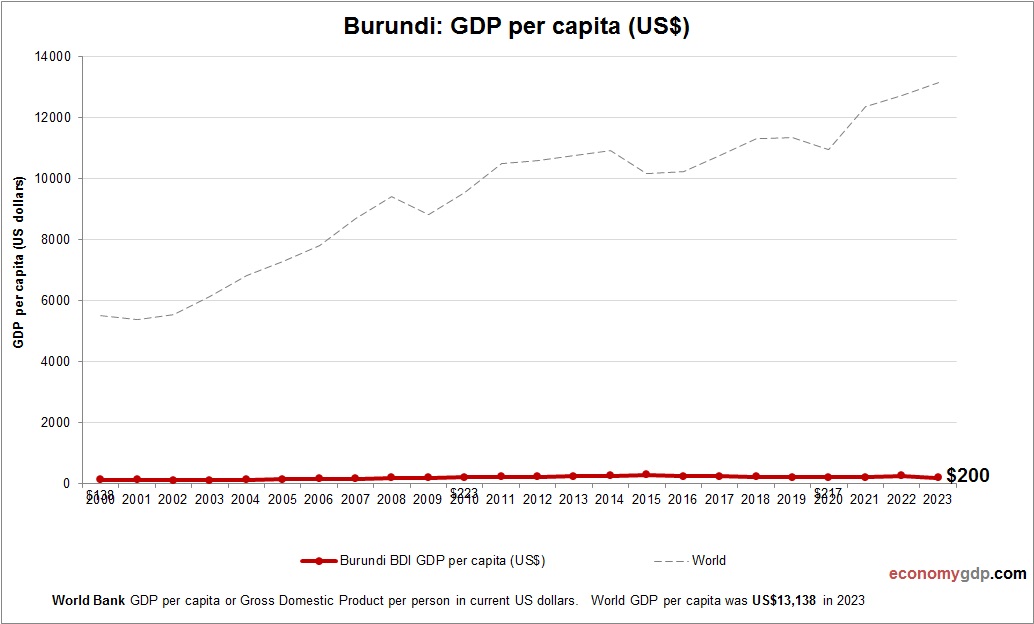
This chart demonstrates Burundi GDP per capita. The gross domestic product statistics are compiled by World Bank. Based on the latest economic info provided for Burundi. Burundi has one of the lowest GDP per capita figures globally, influenced by factors View diagram Burundi GDP per capita