Category Archives: Economy
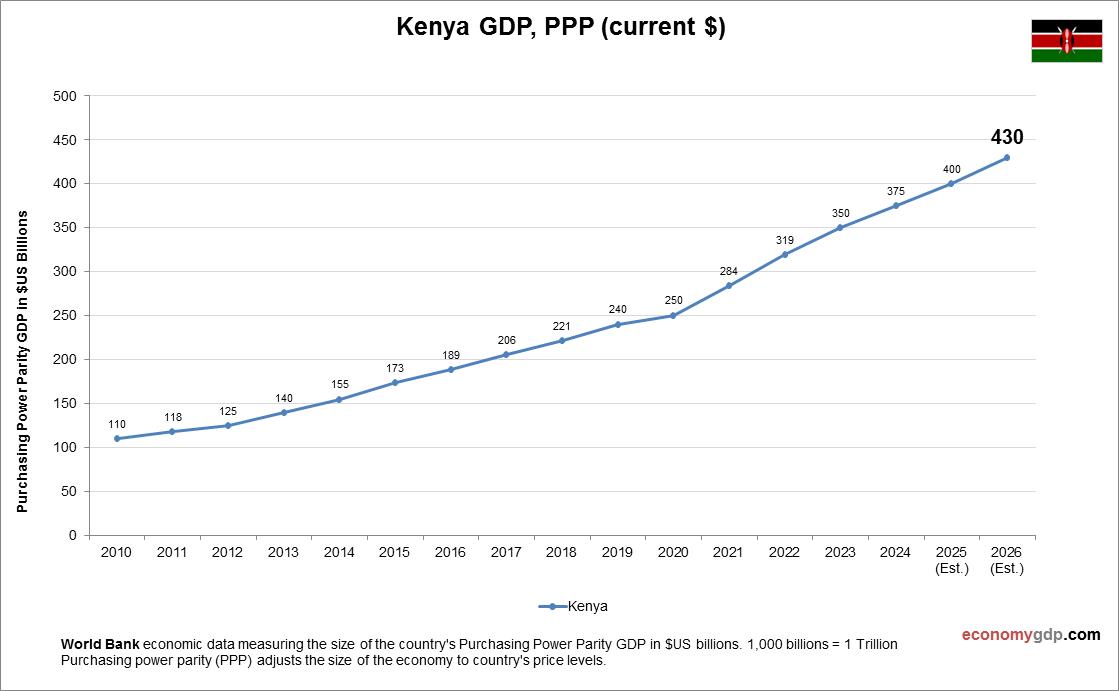
Kenya GDP Purchasing Power Parity
Kenyas GDP (PPP) is estimated at $338.9 billion in 2025. Kenyas economy thrives on agriculture (tea, horticulture), services, and technology, with Nairobi as a fintech hub. The PPP adjustment significantly boosts GDP due to a low cost of living. Infrastructure View diagram Kenya GDP Purchasing Power Parity
Low & middle income Inflation
This chart demonstrates Low & middle income Inflation. The consumer price statistics are compiled by World Bank. Based on the latest economic data provided for Low & middle income. In low and middle-income countries, inflation typically stems from food and View diagram Low & middle income Inflation
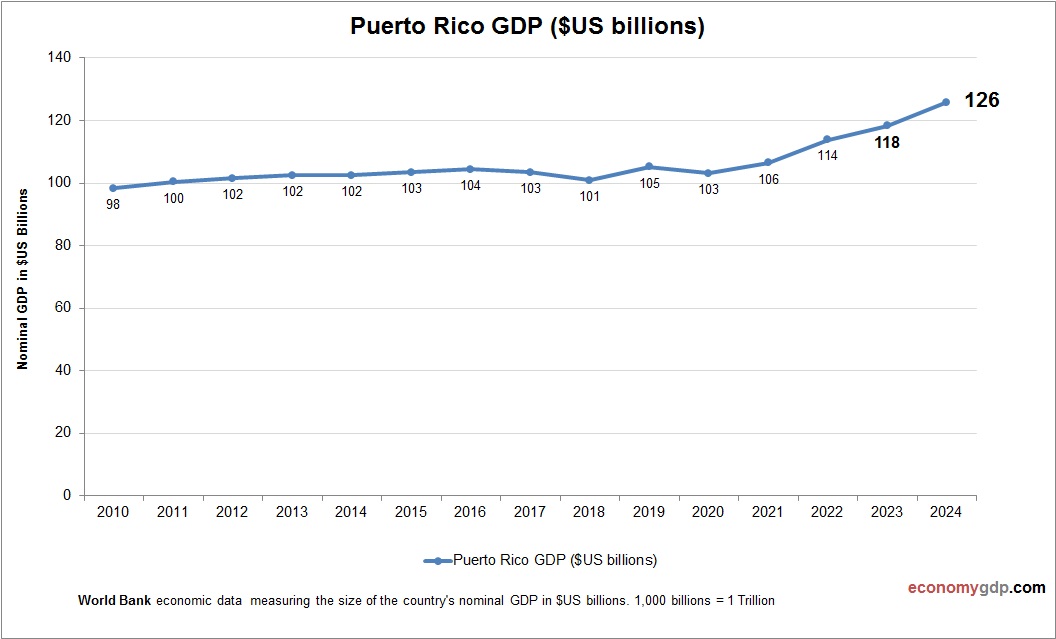
Puerto Rico GDP
Puerto Rico's $130 billion economy, growing 3.0% in 2023, projects steady 2025 recovery through pharmaceuticals, tourism, and services. Per capita GDP nears $38,000. Medical device exports lead, while fuel imports highlight trade gaps. Debt and hurricane recovery remain challenges. Recent View diagram Puerto Rico GDP
San Marino GDP Purchasing Power Parity
San Marinos GDP (PPP) is projected at $2.9 billion in 2025, though data is limited. San Marinos economy relies on tourism, financial services, and small-scale manufacturing. The PPP adjustment moderates GDP due to a high cost of living. Close ties View diagram San Marino GDP Purchasing Power Parity
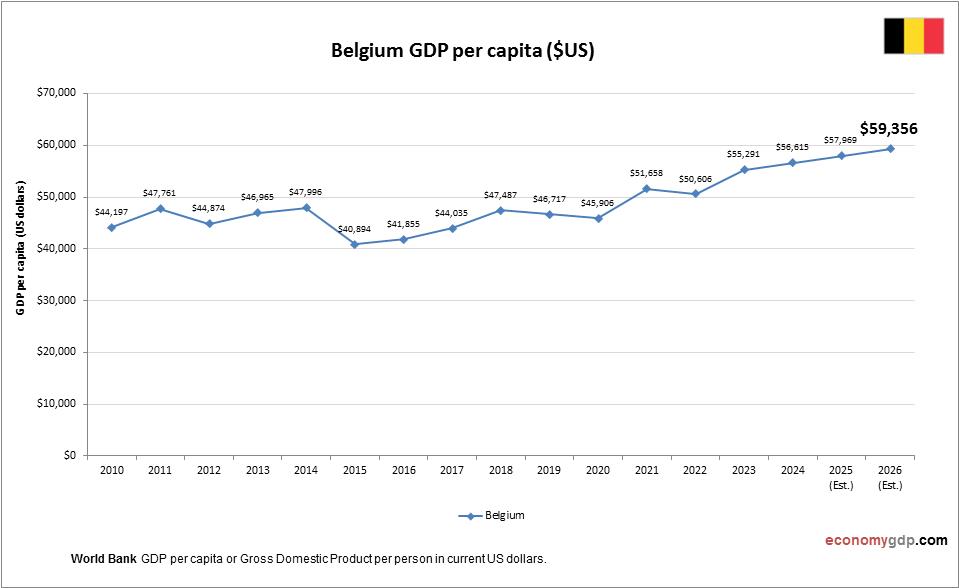
Belgium GDP per capita
This graph shows Belgium GDP per capita. The economic data is provided by World Bank. Latest GDP per person information for Belgium. Belgium boasts a high GDP per capita, reflecting its advanced economy with strengths in sectors like chemicals, machinery, View diagram Belgium GDP per capita
Canada Inflation
This graph shows Canada Inflation. Inflation data is sourced from World Bank. Change in consumer prices for Canada. Canadas inflation is influenced by housing market pressures, global supply chain issues, and energy price volatility, with monetary policy adjusting to rising View diagram Canada Inflation
Dominica Economy
Croatia GDP
Croatia's $75 billion economy, growing 2.7% in 2025, excels in tourism, shipbuilding, and EU trade, with per capita GDP at $19,000. Olive oil exports grow, but energy imports strain trade for its 4 million residents. Regional disparities and 60% debt View diagram Croatia GDP
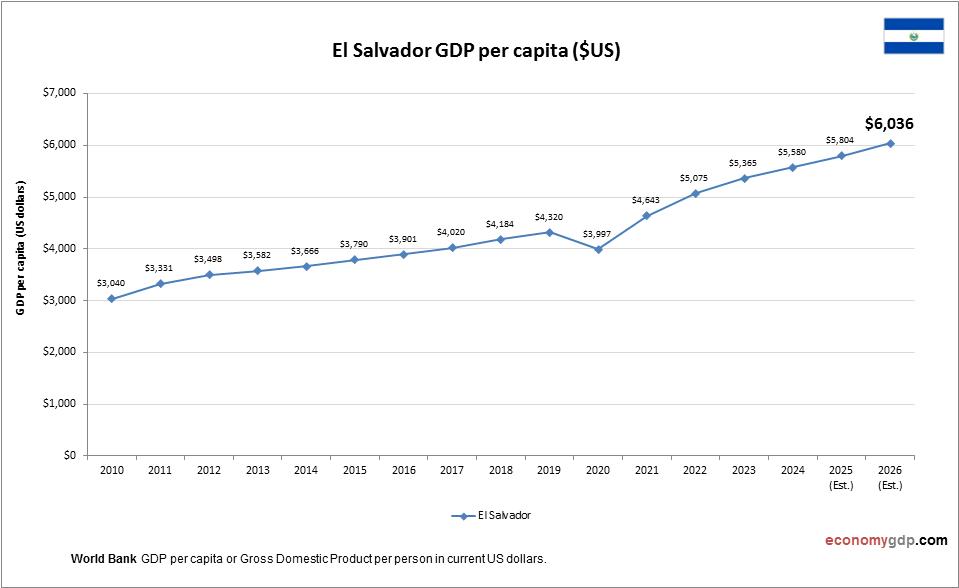
El Salvador GDP per capita
This chart demonstrates El Salvador GDP per capita. This is according to World Bank GDP stats by country. Latest GDP per person information for El Salvador. El Salvador’s GDP per capita has shown a steady increase in recent years. The View diagram El Salvador GDP per capita