Guinea-Bissau Children Per woman
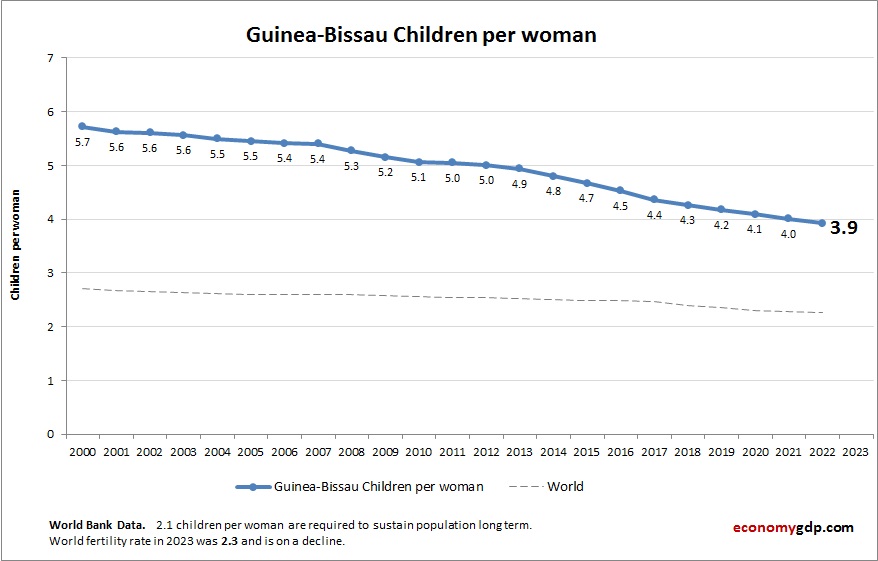
The above graph shows Guinea-Bissau Children Per woman. World Bank is the source of this birth data. Based on the latest demographics info provided for Guinea-Bissau. Guinea-Bissau has a high children per woman rate. Persistent poverty, rural living, and traditional View diagram Guinea-Bissau Children Per woman