Skip to content
cropped-economygdp.jpg

Economy GDP

World economy charts, business frameworks and diagrams

Menu

Primary menu

  • Economy
    • Top Economies
  • Demographics
  • Business
    • Strategy
    • Project Management
    • Industry Examples
    • Leadership
    • HR
    • Industry Examples
  • Framework
  • Analysis
  • Lean Six Sigma
    • Lean
  • IT
    • Social Media
  • Marketing
  • Stories
  • Top

Category Archives: Demographics

Bulgaria Fertility Rate

Bulgaria Fertility Rate

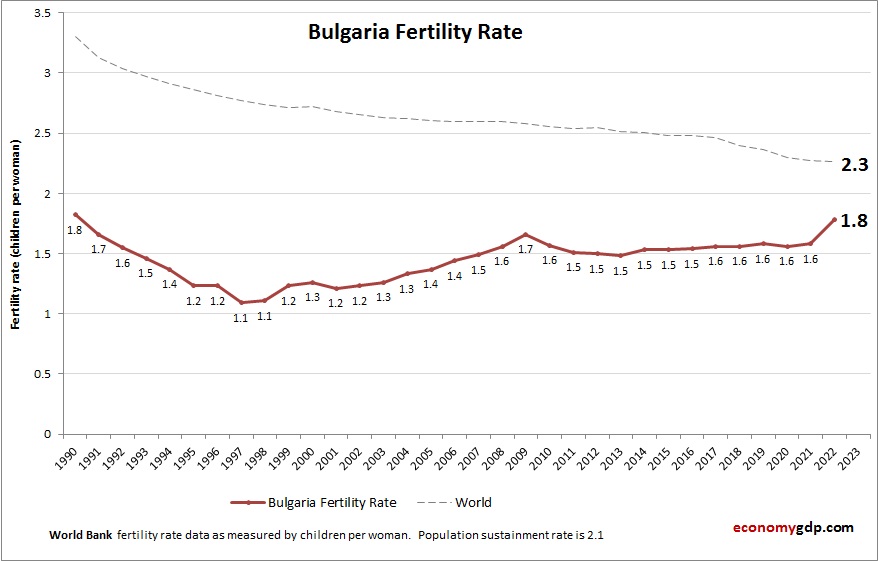
This diagram presents Bulgaria Fertility Rate. World Bank is the source of this birth data. Based on the latest available information for Bulgaria. Bulgaria’s fertility rate remains among the lowest in the world. High emigration, delayed marriages, and economic concerns View diagram Bulgaria Fertility Rate→

Posted in Demographics

Marshall Islands Fertility Rate

Marshall Islands Fertility Rate

Chart above demonstrates Marshall Islands Fertility Rate. The fertility rate statistics are compiled by World Bank. Latest births per woman information for Marshall Islands. The Marshall Islands have a relatively high fertility rate. Cultural traditions, limited healthcare infrastructure, and economic View diagram Marshall Islands Fertility Rate→

Posted in Demographics | Tagged Marshall Islands statistics

Russia Fertility Rate

Russia Fertility Rate

This diagram presents Russia Fertility Rate. The fertility rate statistics are compiled by World Bank. Latest births per woman information for Russia. Russia’s fertility rate is low and declining. Government policies encouraging larger families have had limited success in reversing View diagram Russia Fertility Rate→

Posted in Demographics | Tagged Russia statistics

Libya Fertility Rate

Libya Fertility Rate

This diagram presents Libya Fertility Rate. This is according to World Bank birth stats by country. Based on the latest available information for Libya. Libya’s fertility rate is moderate but affected by ongoing conflict and instability, which influence family planning View diagram Libya Fertility Rate→

Posted in Demographics | Tagged Libya statistics

St. Vincent and the Grenadines Children Per woman

St. Vincent and the Grenadines Children Per woman

This diagram presents St. Vincent and the Grenadines Children Per woman. World Bank is the source of this birth data. Based on the latest demographics info provided for St. Vincent and the Grenadines. Women here tend to have about two View diagram St. Vincent and the Grenadines Children Per woman→

Posted in Demographics | Tagged St. Vincent and the Grenadines statistics

United Arab Emirates Children Per woman

United Arab Emirates Children Per woman

Chart above demonstrates United Arab Emirates Children Per woman. This is according to World Bank birth stats by country. Based on the latest available information for United Arab Emirates. Women in the UAE have fewer than two children on average, View diagram United Arab Emirates Children Per woman→

Posted in Demographics

Burkina Faso Fertility Rate

Burkina Faso Fertility Rate

Chart above demonstrates Burkina Faso Fertility Rate. The fertility rate statistics are compiled by World Bank. Latest births per woman information for Burkina Faso. Burkina Faso continues to have a high fertility rate. Rural norms, low levels of female education, View diagram Burkina Faso Fertility Rate→

Posted in Demographics | Tagged Burkina Faso statistics

Ireland Children Per woman

Ireland Children Per woman

The above graph shows Ireland Children Per woman. This is according to World Bank birth stats by country. Based on the latest available information for Ireland. Ireland maintains a relatively high fertility rate compared to other European countries, supported by View diagram Ireland Children Per woman→

Posted in Demographics | Tagged Ireland statistics

Lithuania Children Per woman

Lithuania Children Per woman

Chart above demonstrates Lithuania Children Per woman. This is according to World Bank birth stats by country. Based on the latest available information for Lithuania. Lithuania experiences low fertility, with women averaging fewer than two children, a reflection of economic View diagram Lithuania Children Per woman→

Posted in Demographics | Tagged Lithuania statistics

Netherlands Fertility Rate

Netherlands Fertility Rate

The above graph shows Netherlands Fertility Rate. World Bank is the source of this birth data. Based on the latest demographics info provided for Netherlands. The Netherlands has a low fertility rate. Though supported by strong family benefits, lifestyle choices View diagram Netherlands Fertility Rate→

Posted in Demographics

Post navigation

← Older posts
Newer posts →

Primary Sidebar Widget Area

Top Diagrams

Latest Posts

  • Seychelles Inflation
  • Nauru GDP Purchasing Power Parity
  • Research Methodology Model
  • Fraud Risk Management
  • Cuba GDP
  • Palestine GDP PPP
  • South Korea Inflation
  • Bolivia Economy in Graphs
  • Iceland Fertility Rate
  • Myanmar Economy
  • Cayman Islands GDP Purchasing Power Parity
  • Euro area Fertility Rate
  • Customer Journey Map Example
  • Albania GDP
  • Cayman Islands Fertility Rate
  • Twitter
Copyright © 2026 Economy GDP. All Rights Reserved.
Theme: Catch Box by Catch Themes
Scroll Up