Chile Children Per woman
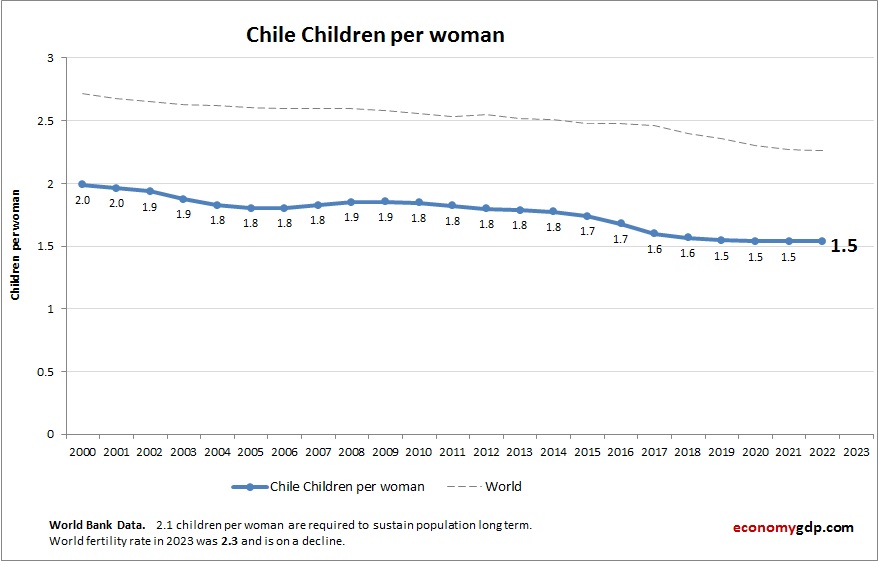
This diagram presents Chile Children Per woman. World Bank is the source of this birth data. Based on the latest demographics info provided for Chile. Chilean women have around two children on average, reflecting demographic transition and improved healthcare.