
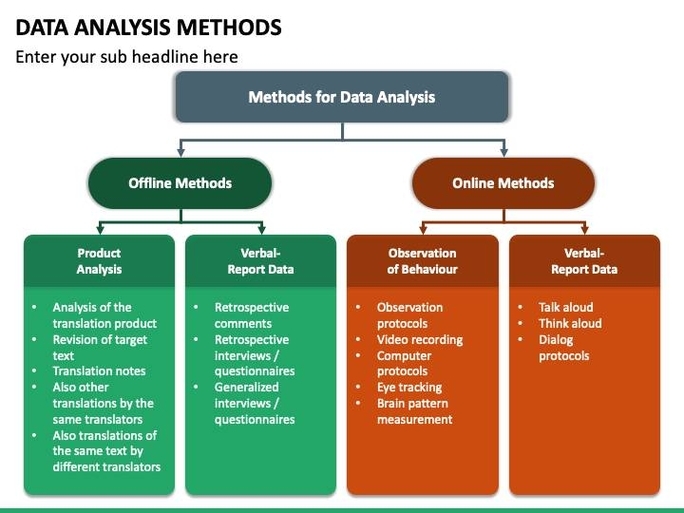
Data Analysis Methods Visual: Data analysis methods visual refers to a graphical representation of the different techniques used in data analysis. These visuals can include flowcharts, diagrams, or bar graphs that show the relationship between various methods like regression analysis, cluster analysis, and hypothesis testing. These visuals help simplify complex data analysis concepts and make it easier to communicate findings.