
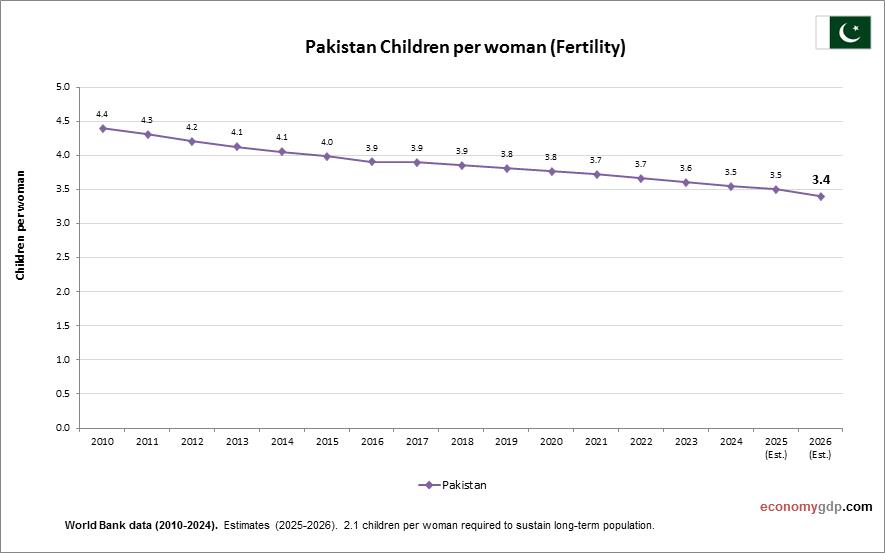
Chart above demonstrates Pakistan Children Per woman. The fertility rate statistics are compiled by World Bank. Latest births per woman information for Pakistan.
Pakistan has a relatively high children per woman rate, though it is gradually decreasing. Socio-cultural norms, low female literacy in rural areas, and inconsistent access to contraception influence this trend.
Pakistan Children Per woman (Fertility Rate) Statistics by Year
| Year | Children per woman (fertility rate) |
| 2000 | 5.35 |
| 2001 | 5.18 |
| 2002 | 5.01 |
| 2003 | 4.89 |
| 2004 | 4.69 |
| 2005 | 4.60 |
| 2006 | 4.59 |
| 2007 | 4.55 |
| 2008 | 4.52 |
| 2009 | 4.47 |
| 2010 | 4.40 |
| 2011 | 4.31 |
| 2012 | 4.20 |
| 2013 | 4.13 |
| 2014 | 4.06 |
| 2015 | 3.99 |
| 2016 | 3.90 |
| 2017 | 3.90 |
| 2018 | 3.86 |
| 2019 | 3.81 |
| 2020 | 3.77 |
| 2021 | 3.72 |
| 2022 | 3.66 |
| 2023 | 3.61 |
| 2024 | 3.55 |
| 2025 (Est.) | 3.50 |
| 2026 (Est.) | 3.40 |