
Iran GDP from 2010 to today. World Bank and OECD data. GDP in US dollars. Iran's GDP relies heavily on its vast oil and natural gas reserves, ranking among the world's largest producers. Energy exports dominate, though sanctions and political challenges have often limited full potential. Agriculture, manufacturing, and services also contribute, with industries producing steel, cement, textiles, and automobiles. Iran has a young, educated population that supports a growing tech and startup scene, though foreign investment remains restricted due to sanctions. Inflation and unemployment remain key challenges, but Iran's strategic geographic position and large domestic market provide opportunities for diversified growth if political and trade barriers ease in the future. See Iran GDP per capita.
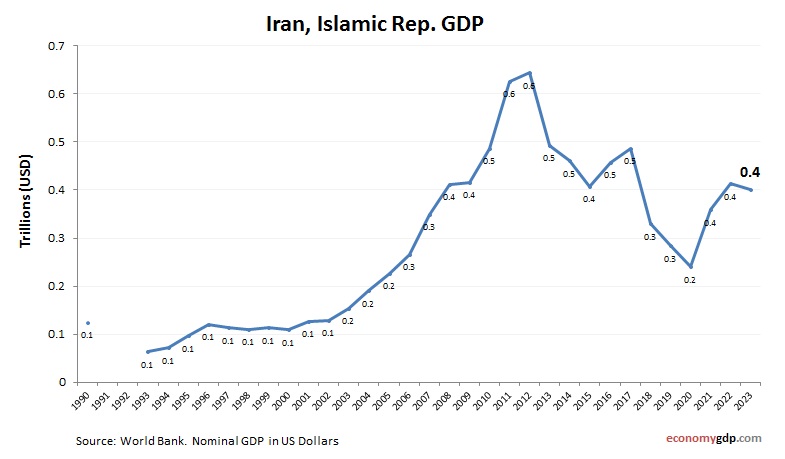
Iran GDP Statistics by Year
| Year | GDP Size (in billions $) |
| 2025 (projected) | 455 |
| 2024 | 437 |
| 2023 | 405 |
| 2022 | 394 |
| 2021 | 383 |
| 2020 | 262 |
| 2019 | 334 |
| 2018 | 399 |
| 2017 | 489 |
| 2016 | 459 |
| 2015 | 409 |
| 2014 | 462 |
| 2013 | 500 |
| 2012 | 644 |
| 2011 | 629 |
| 2010 | 487 |