
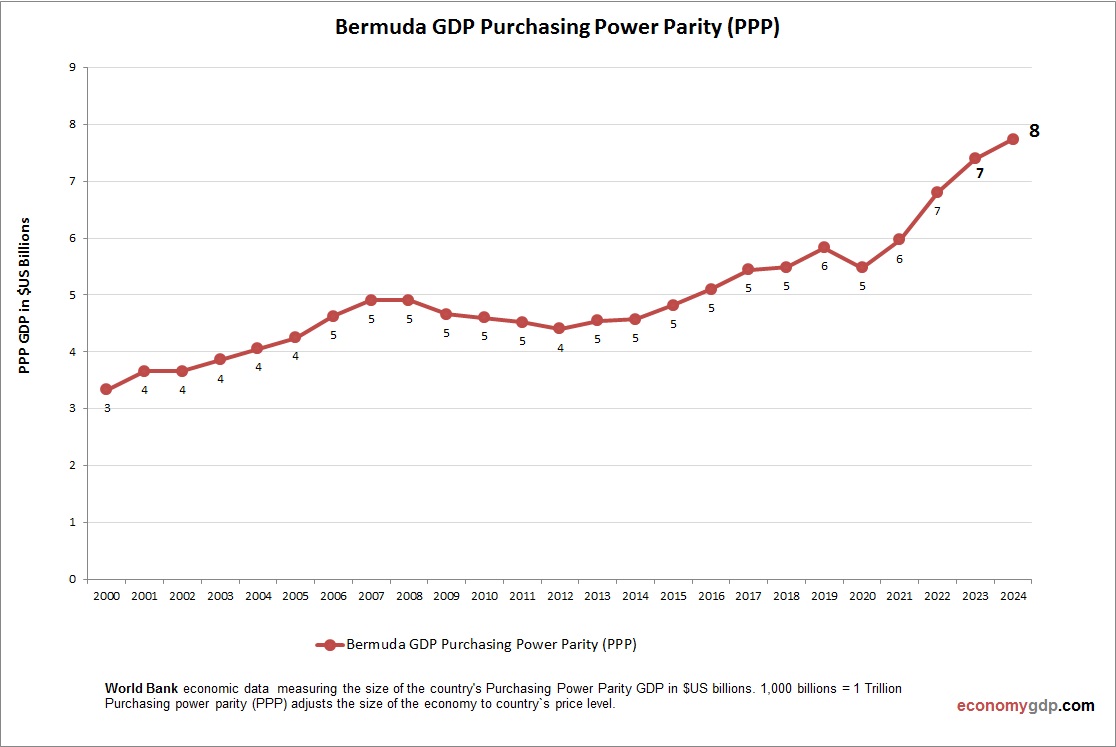
Bermudas PPP GDP was $7.8 billion in 2023. Financial services and tourism dominate, with a GDP per capita (PPP) of $123,100, among the highest globally. Offshore insurance is key, but global tax scrutiny and hurricane risks challenge stability, requiring adaptive policies. See all Bermuda economy graphs.
Bermuda GDP PPP Statistics by Year
| Year | GDP, Purchasing Power Parity (PPP) |
| 2000 | 3.3 |
| 2001 | 3.7 |
| 2002 | 3.7 |
| 2003 | 3.9 |
| 2004 | 4.1 |
| 2005 | 4.3 |
| 2006 | 4.6 |
| 2007 | 4.9 |
| 2008 | 4.9 |
| 2009 | 4.7 |
| 2010 | 4.6 |
| 2011 | 4.5 |
| 2012 | 4.4 |
| 2013 | 4.5 |
| 2014 | 4.6 |
| 2015 | 4.8 |
| 2016 | 5.1 |
| 2017 | 5.4 |
| 2018 | 5.5 |
| 2019 | 5.8 |
| 2020 | 5.5 |
| 2021 | 6.0 |
| 2022 | 6.8 |
| 2023 | 7.4 |
| 2024 | 8.0 |
| 2025 (Est.) | 8.4 |
| 2026 (Est.) | 8.8 |