
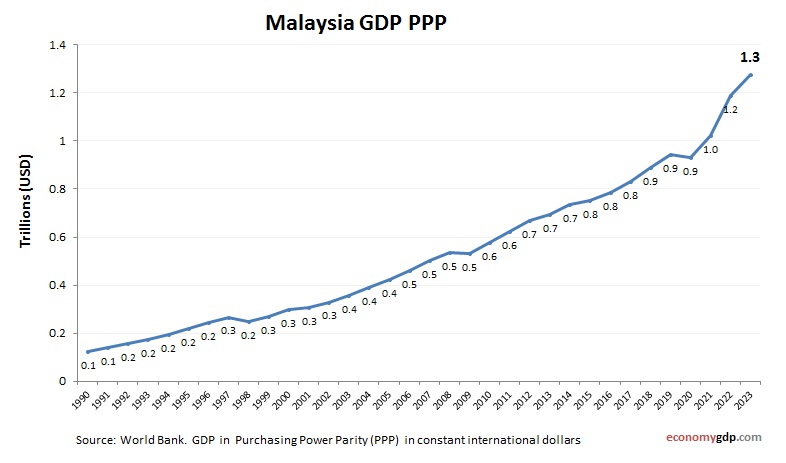
Malaysia economy graph showing purchasing power parity (PPP) growth from 2000 to today. Purchasing power parity adjusts the size of the economy to relevant price levels, i.e. measuring the price of specific goods in different countries and adjusting GDP accordingly.
In 2023, Malaysia’s GDP per capita (PPP) was approximately $32,812, reflecting its status as an upper-middle-income economy. The country boasts a diversified economy, with key sectors including electronics manufacturing, palm oil production, petroleum, and services.
Malaysia GDP PPP Statistics by Year
| Year | GDP, Purchasing Power Parity (PPP) |
| 2000 | 299.2 |
| 2001 | 307.5 |
| 2002 | 329.1 |
| 2003 | 355.1 |
| 2004 | 389.4 |
| 2005 | 423.0 |
| 2006 | 460.4 |
| 2007 | 502.6 |
| 2008 | 537.1 |
| 2009 | 532.2 |
| 2010 | 578.7 |
| 2011 | 621.9 |
| 2012 | 671.5 |
| 2013 | 698.9 |
| 2014 | 746.1 |
| 2015 | 766.0 |
| 2016 | 803.8 |
| 2017 | 854.7 |
| 2018 | 914.7 |
| 2019 | 967.6 |
| 2020 | 931.1 |
| 2021 | 1,022.4 |
| 2022 | 1,194.2 |
| 2023 | 1,280.9 |
| 2024 | 1,378.9 |
| 2025 (Est.) | 1,460.0 |
| 2026 (Est.) | 1,550.0 |