
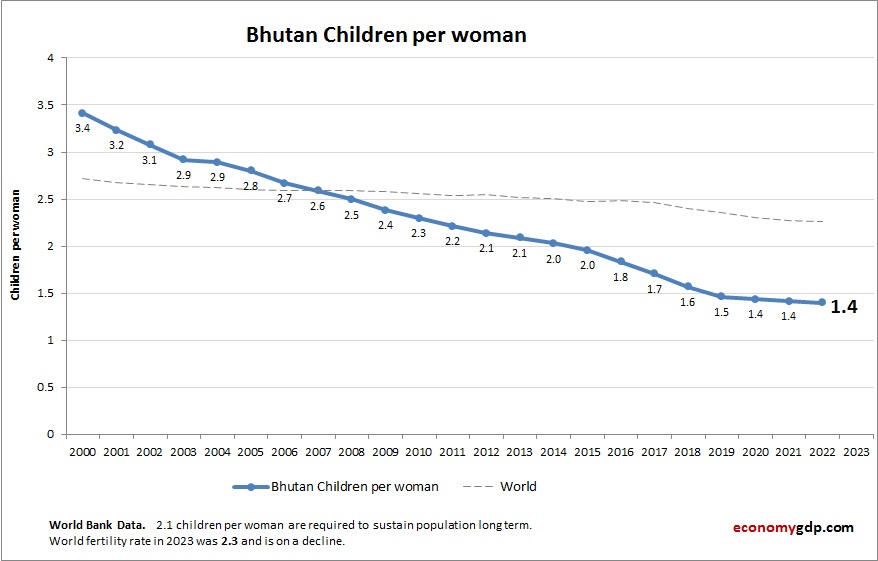
Chart above demonstrates Bhutan Children Per woman. The fertility rate statistics are compiled by World Bank. Based on the latest available information for Bhutan.
Bhutan has a moderate children per woman rate, which has been steadily declining. Government efforts in health and education, along with increased awareness of family planning, are encouraging smaller families.
Bhutan Children Per woman (Fertility Rate) Statistics by Year
| Year | Children per woman (fertility rate) |
| 2000 | 3.38 |
| 2001 | 3.19 |
| 2002 | 3.01 |
| 2003 | 2.87 |
| 2004 | 2.78 |
| 2005 | 2.73 |
| 2006 | 2.66 |
| 2007 | 2.59 |
| 2008 | 2.48 |
| 2009 | 2.36 |
| 2010 | 2.25 |
| 2011 | 2.16 |
| 2012 | 2.07 |
| 2013 | 2.0 |
| 2014 | 1.92 |
| 2015 | 1.84 |
| 2016 | 1.74 |
| 2017 | 1.62 |
| 2018 | 1.52 |
| 2019 | 1.45 |
| 2020 | 1.50 |
| 2021 | 1.49 |
| 2022 | 1.48 |
| 2023 | 1.46 |
| 2024 | 1.45 |
| 2025 (Est.) | 1.40 |
| 2026 (Est.) | 1.40 |