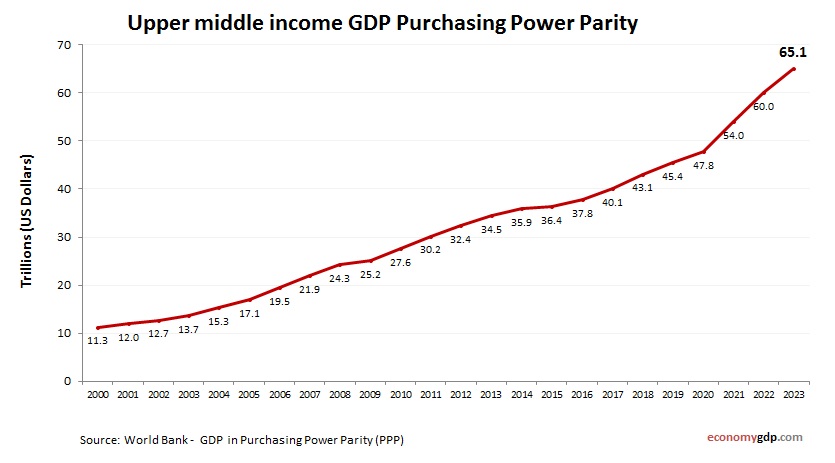
Upper middle income GDP PPP
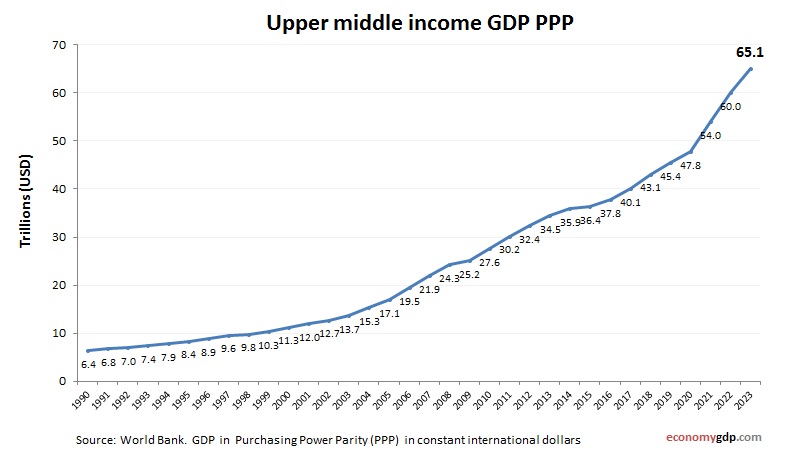
Upper middle income economy graph showing purchasing power parity (PPP) growth from 1990 to today. Purchasing power parity adjusts the size of the economy to relevant price levels, i.e. measuring the price of specific goods in different countries and adjusting View diagram Upper middle income GDP PPP