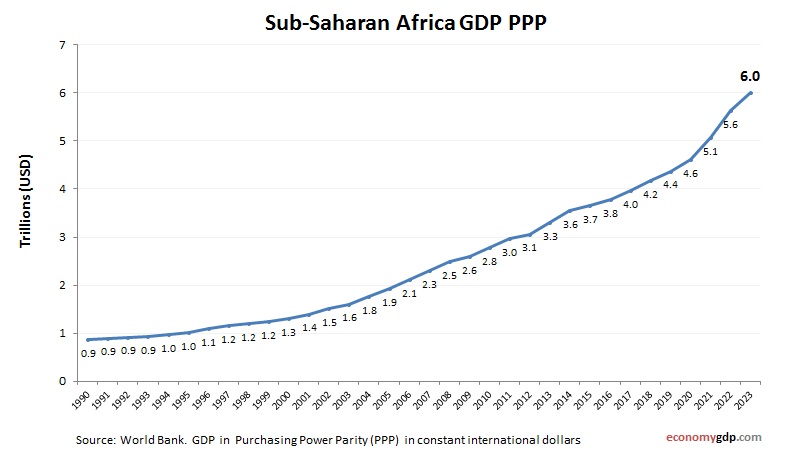
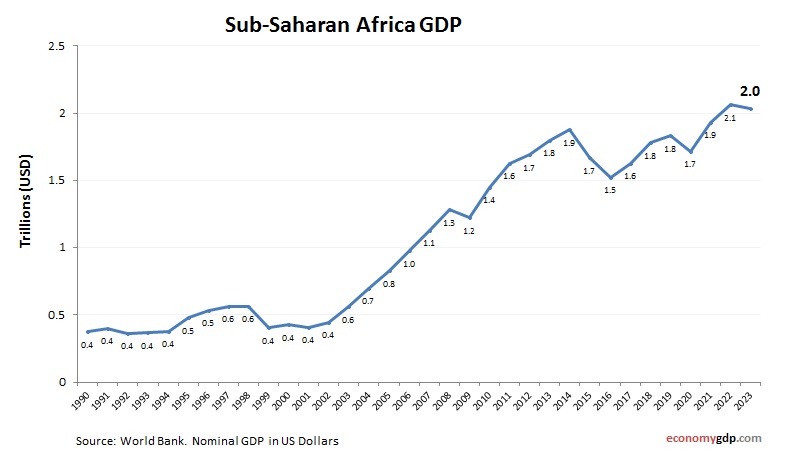
Sub-Saharan Africa Economy

Sub-Saharan Africa economy growth from 2000 to today. GDP (current US$). World Bank and OECD national accounts data. Sub-Saharan Africa includes mostly low- and lower-middle-income economies. Its GDP is driven by agriculture, natural resources, and informal services, with long-term potential View diagram Sub-Saharan Africa Economy