Sub-Saharan Africa (excluding high income) Inflation
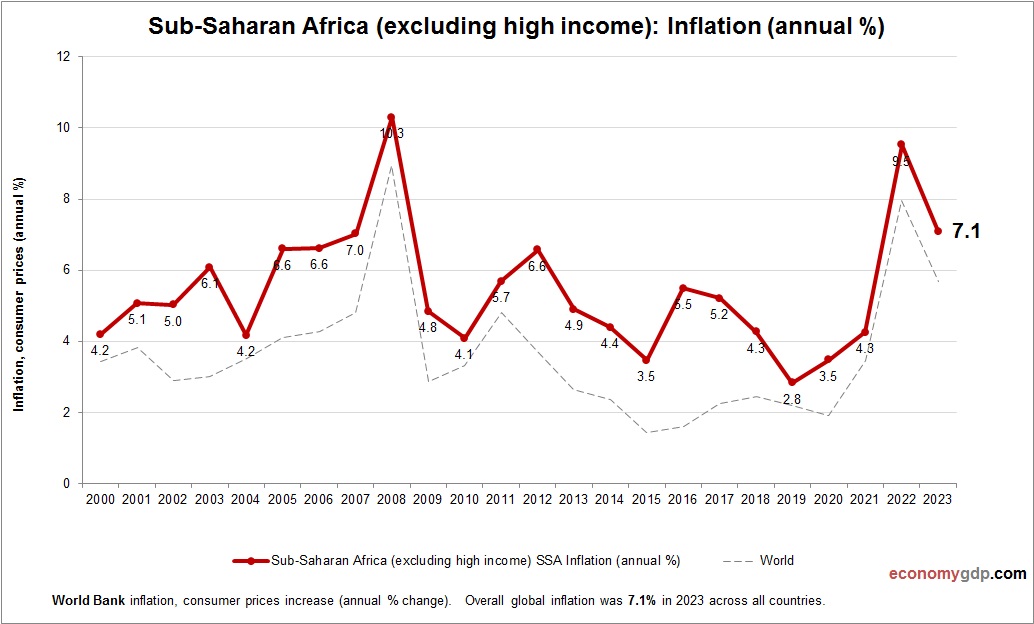
This graph shows Sub-Saharan Africa (excluding high income) Inflation. Inflation data is sourced from World Bank. Change in consumer prices for Sub-Saharan Africa (excluding high income). Inflation in this group is mainly caused by currency depreciation, food insecurity, and fuel View diagram Sub-Saharan Africa (excluding high income) Inflation