Skip to content
cropped-economygdp.jpg

Economy GDP

World economy charts, business frameworks and diagrams

Menu

Primary menu

  • Economy
    • Top Economies
  • Demographics
  • Business
    • Strategy
    • Project Management
    • Industry Examples
    • Leadership
    • HR
    • Industry Examples
  • Framework
  • Analysis
  • Lean Six Sigma
    • Lean
  • IT
    • Social Media
  • Marketing
  • Stories
  • Top

Tag Archives: Sub-Saharan Africa economy

This tag highlights economic information for Sub-Saharan Africa as a whole, including visual data such as GDP charts, inflation trends, PPP figures, and long-term regional growth analysis.

Sub-Saharan Africa Inflation

Sub-Saharan Africa Inflation

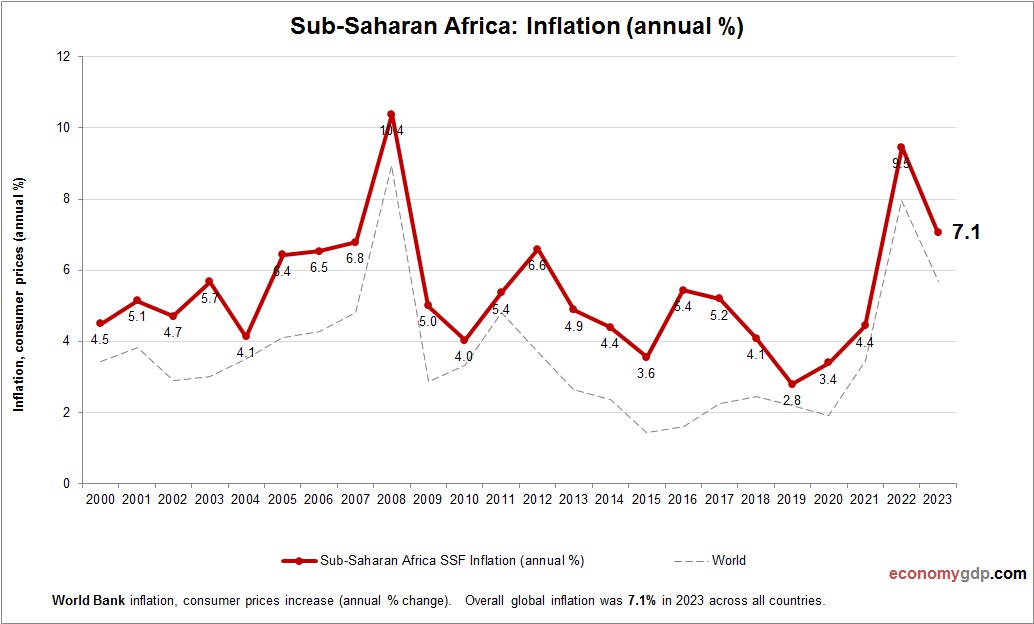
This diagram presents Sub-Saharan Africa Inflation. Inflation data is sourced from World Bank. Change in consumer prices for Sub-Saharan Africa. The region faces inflation from weak currencies, high fuel and food import costs, and economic disruptions due to conflict, climate View diagram Sub-Saharan Africa Inflation→

Posted in Economy | Tagged Sub-Saharan Africa economy

Sub-Saharan Africa GDP per capita

Sub-Saharan Africa GDP per capita

This graph shows Sub-Saharan Africa GDP per capita. This is according to World Bank GDP stats by country. Based on the latest available information for Sub-Saharan Africa. Sub-Saharan Africa’s GDP per capita in 2024 is projected at approximately $1,500. The View diagram Sub-Saharan Africa GDP per capita→

Posted in Economy | Tagged Sub-Saharan Africa economy

Sub-Saharan Africa Economy

Sub-Saharan Africa Economy

Sub-Saharan Africa economy growth from 2000 to today. GDP (current US$). World Bank and OECD national accounts data. Sub-Saharan Africa includes mostly low- and lower-middle-income economies. Its GDP is driven by agriculture, natural resources, and informal services, with long-term potential View diagram Sub-Saharan Africa Economy→

Posted in Economy | Tagged Sub-Saharan Africa economy, Sub-Saharan Africa gdp

Sub-Saharan Africa GDP growth rate

Sub-Saharan Africa GDP growth rate

Sub-Saharan Africa economy annual growth rate from 2000 to today. GDP growth (yearly %). World Bank and OECD national accounts data. The overall GDP growth rate for Sub-Saharan Africa in 2023 was approximately 3.3%. This reflects a diverse economic landscape, View diagram Sub-Saharan Africa GDP growth rate→

Posted in Economy | Tagged Sub-Saharan Africa economy, Sub-Saharan Africa gdp

Sub-Saharan Africa GDP PPP

Sub-Saharan Africa GDP PPP

Sub-Saharan Africa economy graph showing purchasing power parity (PPP) growth from 1990 to today. Purchasing power parity adjusts the size of the economy to relevant price levels, i.e. measuring the price of specific goods in different countries and adjusting GDP View diagram Sub-Saharan Africa GDP PPP→

Posted in Economy | Tagged Sub-Saharan Africa economy, Sub-Saharan Africa gdp

Sub-Saharan Africa GDP Purchasing Power Parity

Sub-Saharan Africa GDP Purchasing Power Parity

Sub-Saharan Africa economy graph showing purchasing power parity (PPP) growth from 2000 to today. Purchasing power parity adjusts the size of the economy to relevant price levels, i.e. measuring the price of specific goods in different countries and adjusting GDP View diagram Sub-Saharan Africa GDP Purchasing Power Parity→

Posted in Economy | Tagged Sub-Saharan Africa economy, Sub-Saharan Africa gdp

Sub-Saharan Africa GDP

Sub-Saharan Africa GDP

Sub-Saharan Africa GDP from 1990 to today. World Bank and OECD data. GDP in US dollars. Sub-Saharan Africa’s GDP reflects a mix of economies with agriculture, mining, and services at the core. Growth is uneven but improving with investment in View diagram Sub-Saharan Africa GDP→

Posted in Economy | Tagged Sub-Saharan Africa economy, Sub-Saharan Africa gdp

Primary Sidebar Widget Area

Top Diagrams

Latest Posts

  • What Is a Business Model
  • Namibia GDP PPP
  • George Soros 1992: Black Wednesday and Pound Sterling Crisis
  • Canada GDP per capita
  • IT Change Management Process Sample of
  • Moldova GDP PPP
  • Tonga Inflation
  • Generative AI Use Cases Model
  • Business Capabilities Model
  • North Korea Inflation
  • Fraud Team Structure
  • Cameroon Children Per woman
  • Silk Road Early Global Trade Network
  • Togo GDP per capita
  • Gabon Inflation
  • Twitter
Copyright © 2025 Economy GDP. All Rights Reserved.
Theme: Catch Box by Catch Themes
Scroll Up