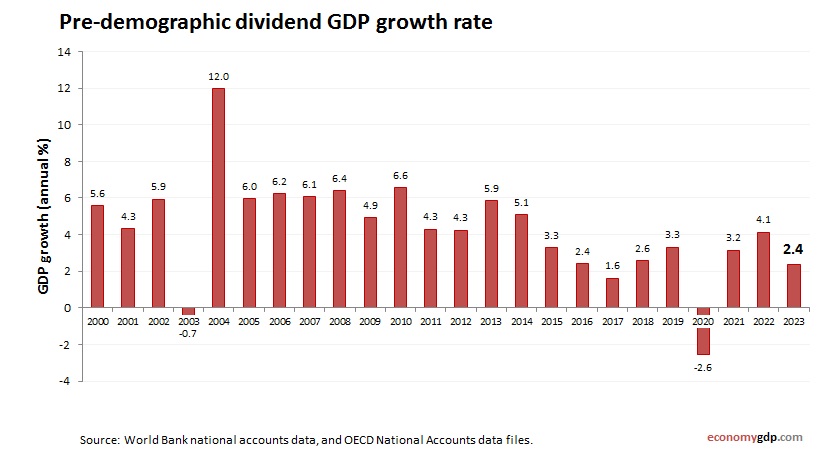
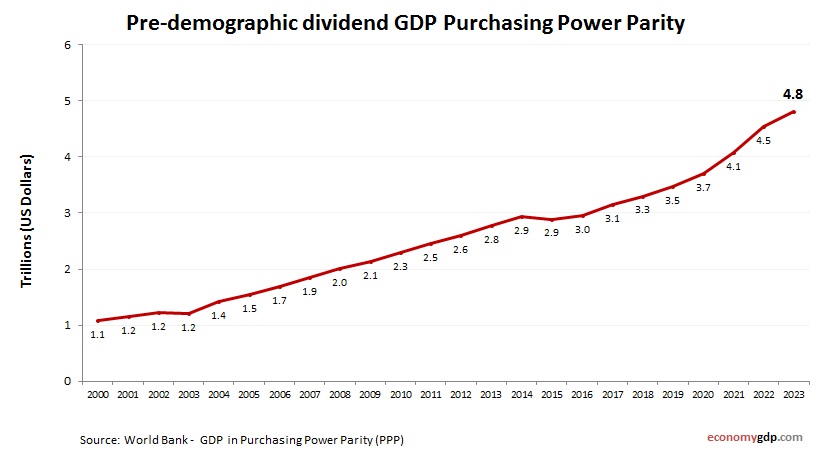
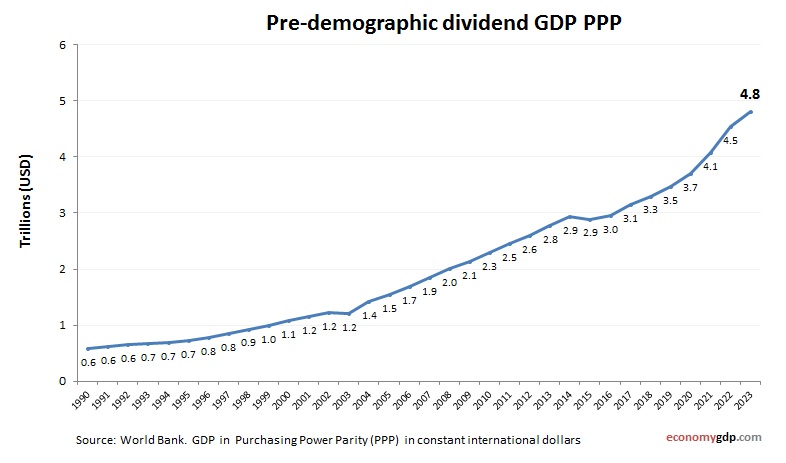
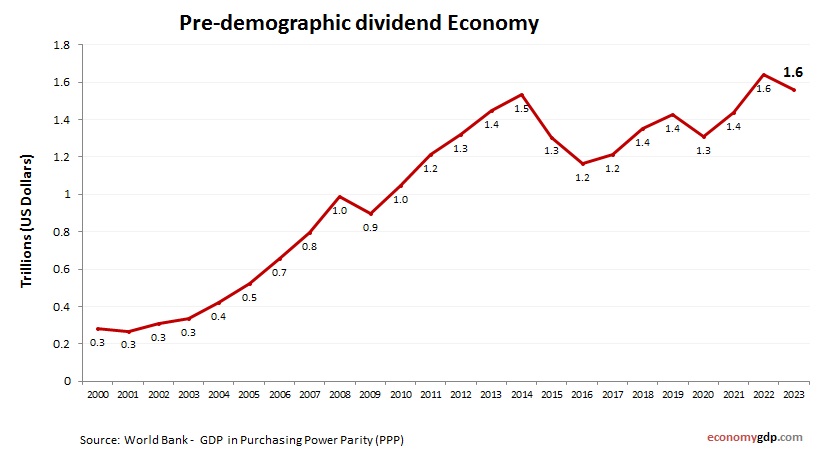
Pre-demographic dividend GDP

Pre-demographic dividend GDP from 1990 to today. World Bank and OECD data. GDP in US dollars. Economies in this phase have a high dependency ratio, resulting in low GDP per capita. Strategic investments in education, health, and job creation are View diagram Pre-demographic dividend GDP