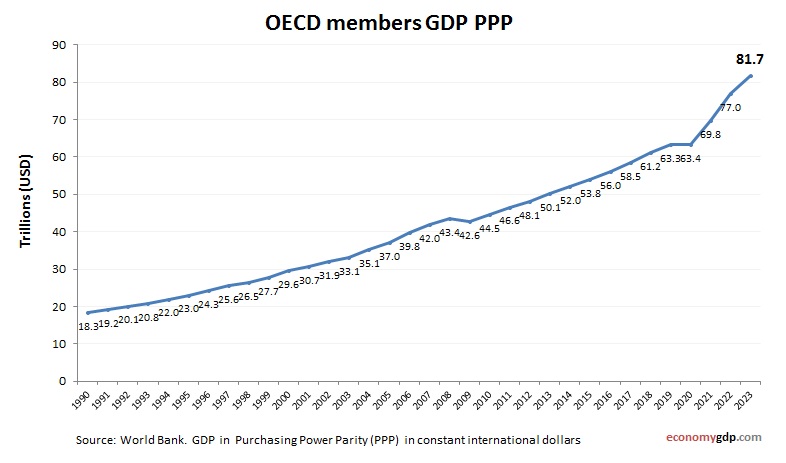
Skip to content
cropped-economygdp.jpg

Economy GDP

World economy charts, business frameworks and diagrams

Menu

Primary menu

  • Economy
    • Top Economies
  • Demographics
  • Business
    • Strategy
    • Project Management
    • Industry Examples
    • Leadership
    • HR
    • Industry Examples
  • Framework
  • Analysis
  • Lean Six Sigma
    • Lean
  • IT
    • Social Media
  • Marketing
  • Stories
  • Top

Tag Archives: OECD members gdp

OECD members GDP

OECD members GDP

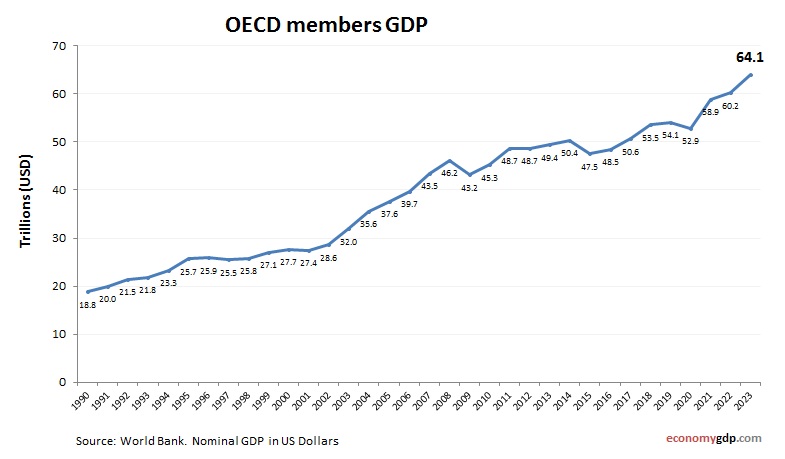
OECD members GDP from 1990 to today. World Bank and OECD data. GDP in US dollars. The GDP of OECD member countries collectively represents a substantial portion of global economic output. These high-income, developed market economies are characterized by advanced View diagram OECD members GDP→

Posted in Economy | Tagged OECD members economy, OECD members gdp

OECD members GDP Purchasing Power Parity

OECD members GDP Purchasing Power Parity

OECD members economy graph showing purchasing power parity (PPP) growth from 2000 to today. Purchasing power parity adjusts the size of the economy to relevant price levels, i.e. measuring the price of specific goods in different countries and adjusting GDP View diagram OECD members GDP Purchasing Power Parity→

Posted in Economy | Tagged OECD members economy, OECD members gdp

OECD members GDP growth rate

OECD members GDP growth rate

OECD members economy annual growth rate from 2000 to today. GDP growth (yearly %). World Bank and OECD national accounts data. OECD member countries posted a collective GDP growth rate of 1.5% in 2023. Most advanced economies within the group View diagram OECD members GDP growth rate→

Posted in Economy | Tagged OECD members economy, OECD members gdp

OECD members Economy

OECD members Economy

OECD members economy growth from 2000 to today. GDP (current US$). World Bank and OECD national accounts data. OECD member countries represent high-income, developed economies with strong regulatory frameworks and innovation-led growth. Their collective GDP constitutes a major portion of View diagram OECD members Economy→

Posted in Economy | Tagged OECD members economy, OECD members gdp

OECD members GDP PPP

OECD members GDP PPP

OECD members economy graph showing purchasing power parity (PPP) growth from 1990 to today. Purchasing power parity adjusts the size of the economy to relevant price levels, i.e. measuring the price of specific goods in different countries and adjusting GDP View diagram OECD members GDP PPP→

Posted in Economy | Tagged OECD members economy, OECD members gdp

Primary Sidebar Widget Area

Top Diagrams

Latest Posts

  • Business Capabilities Model Explained
  • Paraguay GDP
  • Puerto Rico GDP per capita
  • Customer Segmentation Model
  • South Sudan GDP PPP
  • Paraguay GDP per capita
  • Tuvalu GDP per capita
  • Fraud Triangle
  • Togo GDP PPP
  • St. Kitts and Nevis GDP Purchasing Power Parity
  • AI Use Cases in Marketing Automation
  • Ukraine GDP
  • British East India Company 1600: Trade and Empire
  • Honduras Inflation
  • Macedonia GDP PPP
  • Twitter
Copyright © 2025 Economy GDP. All Rights Reserved.
Theme: Catch Box by Catch Themes
Scroll Up