Skip to content
cropped-economygdp.jpg

Economy GDP

World economy charts, business frameworks and diagrams

Menu

Primary menu

  • Economy
    • Top Economies
  • Demographics
  • Business
    • Strategy
    • Project Management
    • Industry Examples
    • Leadership
    • HR
    • Industry Examples
  • Framework
  • Analysis
  • Lean Six Sigma
    • Lean
  • IT
    • Social Media
  • Marketing
  • Stories
  • Top

Tag Archives: North America gdp

North America GDP growth rate

North America GDP growth rate

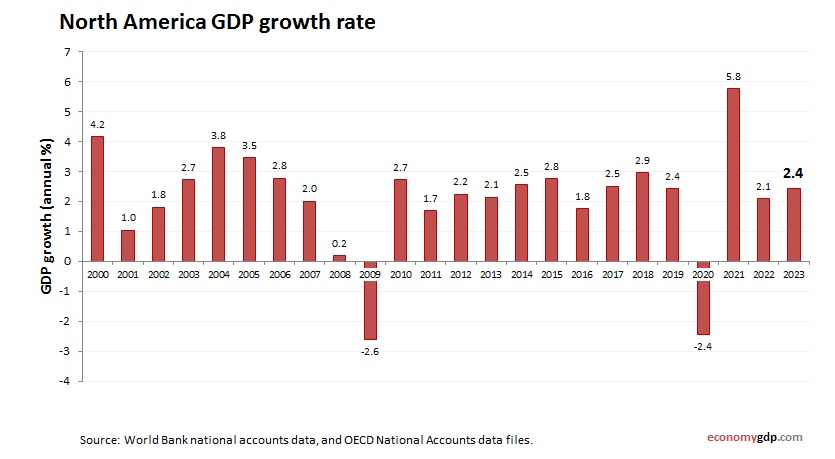
North America economy annual growth rate from 2000 to today. GDP growth (yearly %). World Bank and OECD national accounts data. The North American region, including the U.S., Canada, and Mexico, experienced a GDP growth rate of 2.43% in 2023. View diagram North America GDP growth rate→

Posted in Economy | Tagged North America economy, North America gdp

North America GDP PPP

North America GDP PPP

North America economy graph showing purchasing power parity (PPP) growth from 1990 to today. Purchasing power parity adjusts the size of the economy to relevant price levels, i.e. measuring the price of specific goods in different countries and adjusting GDP View diagram North America GDP PPP→

Posted in Economy | Tagged North America economy, North America gdp

North America GDP

North America GDP

North America GDP from 2010 to today. World Bank and OECD data. GDP in US dollars. North America's $32 trillion economy, growing 2.0% in 2025, is led by U.S. technology and Canada's resources, with Mexico's manufacturing rising. Key sectors include View diagram North America GDP→

Posted in Economy | Tagged North America economy, North America gdp

North America Economy

North America Economy

North America's economy—driven by the United States, Canada, and Mexico—is one of the world's largest and most diversified economic regions. The U.S. leads in technology, finance, health care, and advanced manufacturing, while Canada contributes through natural resources, clean energy, services, View diagram North America Economy→

Posted in Economy | Tagged North America economy, North America gdp

North America GDP Purchasing Power Parity

North America GDP Purchasing Power Parity

North America economy graph showing purchasing power parity (PPP) growth from 2000 to today. Purchasing power parity adjusts the size of the economy to relevant price levels, i.e. measuring the price of specific goods in different countries and adjusting GDP View diagram North America GDP Purchasing Power Parity→

Posted in Economy | Tagged North America economy, North America gdp

Primary Sidebar Widget Area

Top Diagrams

Latest Posts

  • Business Capabilities Model Explained
  • Paraguay GDP
  • Puerto Rico GDP per capita
  • Customer Segmentation Model
  • South Sudan GDP PPP
  • Paraguay GDP per capita
  • Tuvalu GDP per capita
  • Fraud Triangle
  • Togo GDP PPP
  • St. Kitts and Nevis GDP Purchasing Power Parity
  • AI Use Cases in Marketing Automation
  • Ukraine GDP
  • British East India Company 1600: Trade and Empire
  • Honduras Inflation
  • Macedonia GDP PPP
  • Twitter
Copyright © 2025 Economy GDP. All Rights Reserved.
Theme: Catch Box by Catch Themes
Scroll Up