Skip to content
cropped-economygdp.jpg

Economy GDP

World economy charts, business frameworks and diagrams

Menu

Primary menu

  • Economy
    • Top Economies
  • Demographics
  • Business
    • Strategy
    • Project Management
    • Industry Examples
    • Leadership
    • HR
    • Industry Examples
  • Framework
  • Analysis
  • Lean Six Sigma
    • Lean
  • IT
    • Social Media
  • Marketing
  • Stories
  • Top

Tag Archives: Middle income gdp

Middle income GDP

Middle income GDP

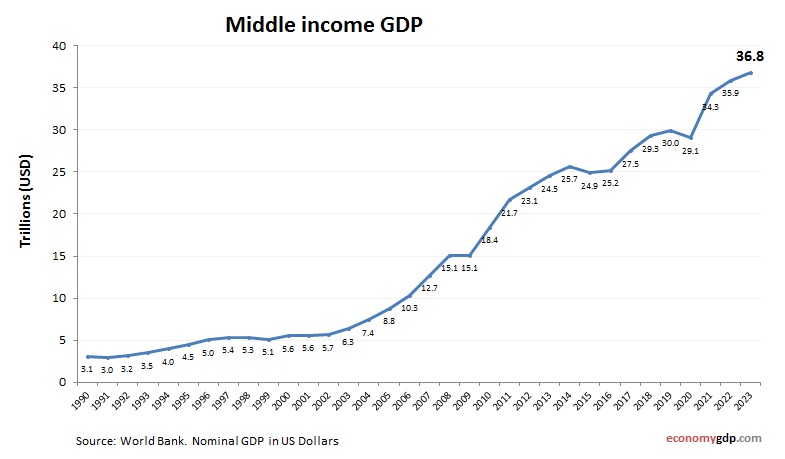
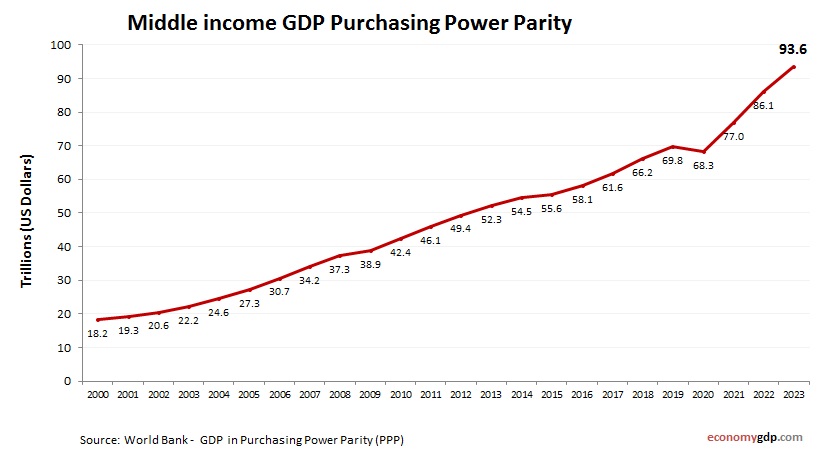
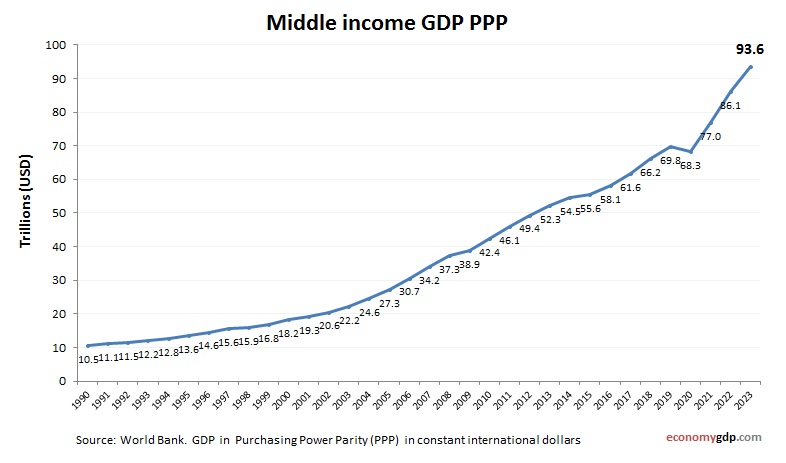
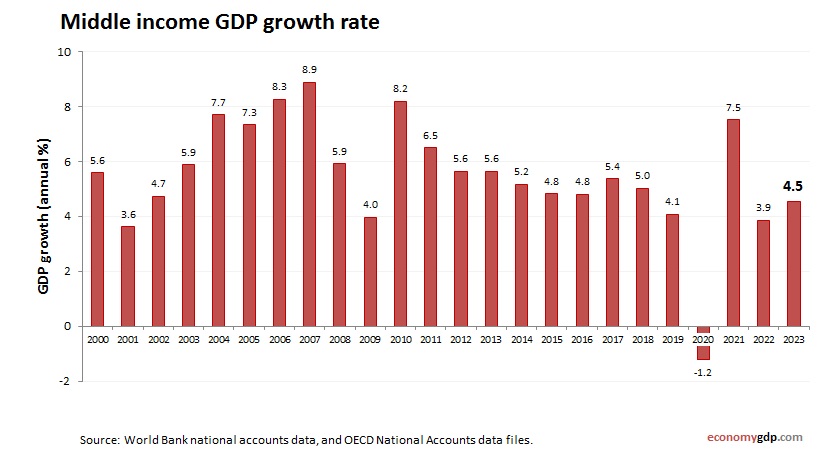
Middle income GDP from 1990 to today. World Bank and OECD data. GDP in US dollars. Middle-income countries produce moderate GDP levels with varied economic structures. Growth is often driven by manufacturing, services, and exports, though many face challenges in View diagram Middle income GDP→

Posted in Economy | Tagged Middle income economy, Middle income gdp

Middle income GDP Purchasing Power Parity

Middle income GDP Purchasing Power Parity

Middle income economy graph showing purchasing power parity (PPP) growth from 2000 to today. Purchasing power parity adjusts the size of the economy to relevant price levels, i.e. measuring the price of specific goods in different countries and adjusting GDP View diagram Middle income GDP Purchasing Power Parity→

Posted in Economy | Tagged Middle income economy, Middle income gdp

Middle income GDP PPP

Middle income GDP PPP

Middle income economy graph showing purchasing power parity (PPP) growth from 1990 to today. Purchasing power parity adjusts the size of the economy to relevant price levels, i.e. measuring the price of specific goods in different countries and adjusting GDP View diagram Middle income GDP PPP→

Posted in Economy | Tagged Middle income economy, Middle income gdp

Middle income GDP growth rate

Middle income GDP growth rate

Middle income economy annual growth rate from 2000 to today. GDP growth (yearly %). World Bank and OECD national accounts data. Middle-income countries collectively achieved a GDP growth rate of approximately 4.0% in 2023. The group showed diverse outcomes, with View diagram Middle income GDP growth rate→

Posted in Economy | Tagged Middle income economy, Middle income gdp

Middle income Economy

Middle income Economy

Middle income economy growth from 2000 to today. GDP (current US$). World Bank and OECD national accounts data. Middle-income economies show growing GDPs with structural transformation from agriculture to services and industry. They often face the “middle-income trap” and work View diagram Middle income Economy→

Posted in Economy | Tagged Middle income economy, Middle income gdp

Primary Sidebar Widget Area

Top Diagrams

Latest Posts

  • Slovenia GDP Purchasing Power Parity
  • Romania Economy
  • Process Improvement Methodologies Model
  • Kiribati Economy
  • Corporate Fraud Risk Management
  • Top AI Use Cases
  • Customer Journey Diagram Illustrated Representation Explanation
  • AI Use Cases in Telecom Industry
  • Hungary GDP Purchasing Power Parity
  • Hungary Fertility Rate
  • Kuwait Economy
  • East Asia & Pacific GDP per capita
  • 7 Steps in Scientific Investigation
  • Exponential Business Model
  • Business Model Definition
  • Twitter
Copyright © 2026 Economy GDP. All Rights Reserved.
Theme: Catch Box by Catch Themes
Scroll Up