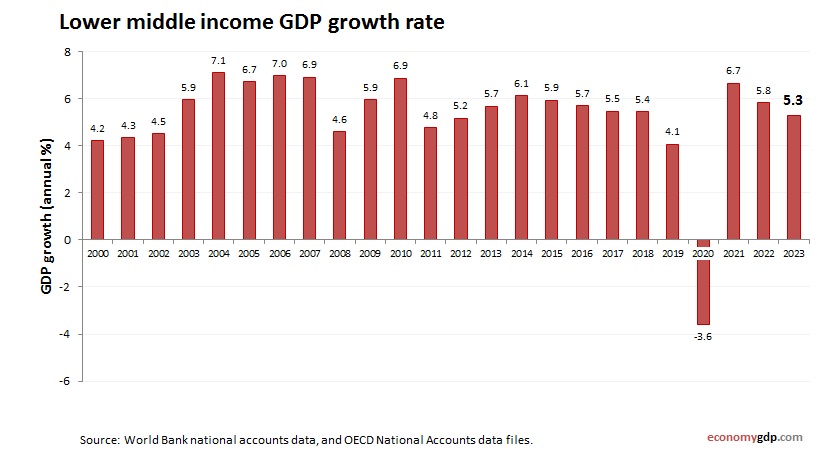
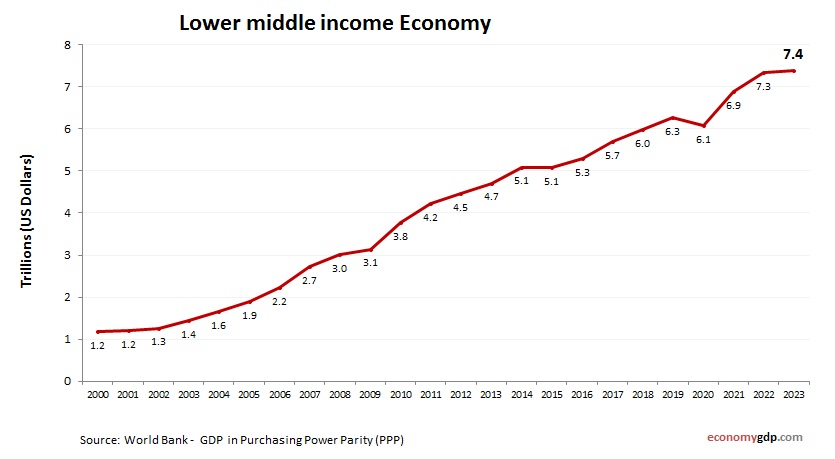
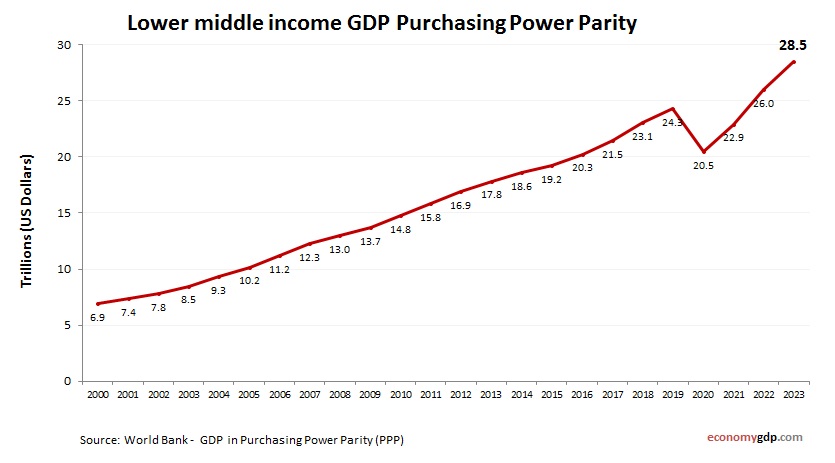
Lower middle income GDP

Lower middle income GDP from 1990 to today. World Bank and OECD data. GDP in US dollars. Lower-middle-income countries have moderate GDP levels supported by manufacturing, agriculture, and emerging services sectors. Growth often depends on industrialization, export expansion, and foreign View diagram Lower middle income GDP