Skip to content
cropped-economygdp.jpg

Economy GDP

World economy charts, business frameworks and diagrams

Menu

Primary menu

  • Economy
    • Top Economies
  • Demographics
  • Business
    • Strategy
    • Project Management
    • Industry Examples
    • Leadership
    • HR
    • Industry Examples
  • Framework
  • Analysis
  • Lean Six Sigma
    • Lean
  • IT
    • Social Media
  • Marketing
  • Stories
  • Top

Tag Archives: Lower middle income economy

Posts under this tag analyze lower-middle-income economies, highlighting GDP growth, PPP, and inflation through clear, comparative visual data.

Lower middle income GDP per capita

Lower middle income GDP per capita

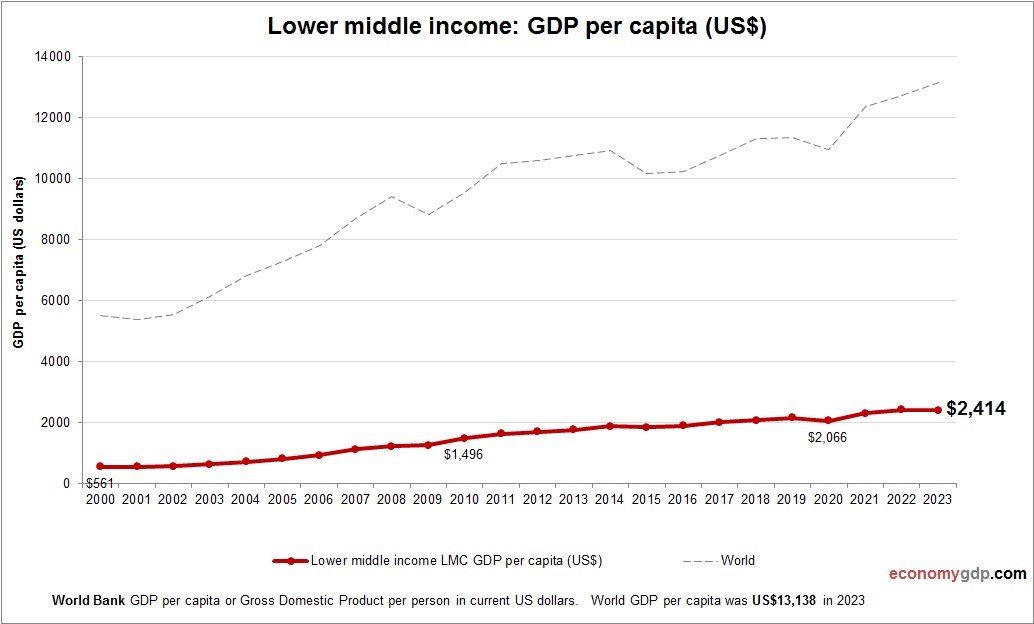
This chart demonstrates Lower middle income GDP per capita. The economic data is provided by World Bank. Based on the latest economic info provided for Lower middle income.

Posted in Economy | Tagged Lower middle income economy, Lower middle income statistics

Lower middle income Inflation

Lower middle income Inflation

This chart demonstrates Lower middle income Inflation. Inflation data is sourced from World Bank. Change in consumer prices for Lower middle income. Lower-middle-income countries experience inflation from rising consumer demand, limited production capacity, and external shocks affecting trade and currency View diagram Lower middle income Inflation→

Posted in Economy | Tagged Lower middle income economy, Lower middle income statistics

Lower middle income GDP

Lower middle income GDP

Lower middle income GDP from 1990 to today. World Bank and OECD data. GDP in US dollars. Lower-middle-income countries have moderate GDP levels supported by manufacturing, agriculture, and emerging services sectors. Growth often depends on industrialization, export expansion, and foreign View diagram Lower middle income GDP→

Posted in Economy | Tagged Lower middle income economy, Lower middle income gdp

Lower middle income GDP growth rate

Lower middle income GDP growth rate

Lower middle income economy annual growth rate from 2000 to today. GDP growth (yearly %). World Bank and OECD national accounts data. Lower middle-income countries achieved a GDP growth rate of about 4.3% in 2023. Key drivers included infrastructure development, View diagram Lower middle income GDP growth rate→

Posted in Economy | Tagged Lower middle income economy, Lower middle income gdp

Lower middle income Economy

Lower middle income Economy

Lower middle income economy growth from 2000 to today. GDP (current US$). World Bank and OECD national accounts data. Lower-middle-income economies are in transition from subsistence agriculture to industrialization. Their GDPs grow through labor-intensive manufacturing, services, and increasing regional trade.

Posted in Economy | Tagged Lower middle income economy, Lower middle income gdp

Lower middle income GDP Purchasing Power Parity

Lower middle income GDP Purchasing Power Parity

Lower middle income economy graph showing purchasing power parity (PPP) growth from 2000 to today. Purchasing power parity adjusts the size of the economy to relevant price levels, i.e. measuring the price of specific goods in different countries and adjusting View diagram Lower middle income GDP Purchasing Power Parity→

Posted in Economy | Tagged Lower middle income economy, Lower middle income gdp

Primary Sidebar Widget Area

Top Diagrams

Latest Posts

  • Business Capabilities Model Explained
  • Paraguay GDP
  • Puerto Rico GDP per capita
  • Customer Segmentation Model
  • South Sudan GDP PPP
  • Paraguay GDP per capita
  • Tuvalu GDP per capita
  • Fraud Triangle
  • Togo GDP PPP
  • St. Kitts and Nevis GDP Purchasing Power Parity
  • AI Use Cases in Marketing Automation
  • Ukraine GDP
  • British East India Company 1600: Trade and Empire
  • Honduras Inflation
  • Macedonia GDP PPP
  • Twitter
Copyright © 2025 Economy GDP. All Rights Reserved.
Theme: Catch Box by Catch Themes
Scroll Up