Low income GDP per capita
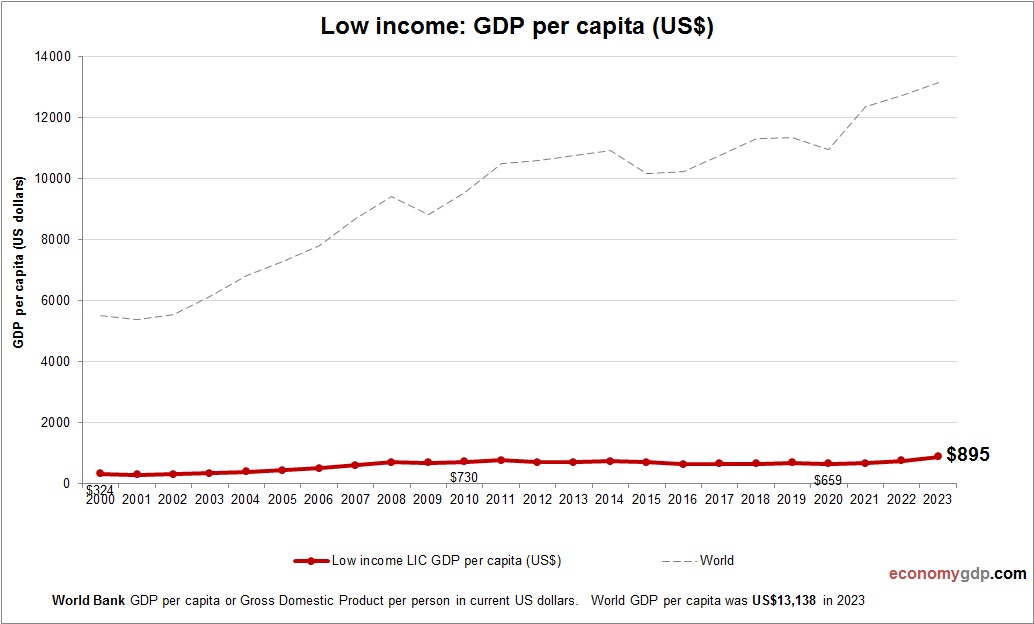
This graph shows Low income GDP per capita. The gross domestic product statistics are compiled by World Bank. Based on the latest economic info provided for Low income.

World economy charts, business frameworks and diagrams
This graph shows Low income GDP per capita. The gross domestic product statistics are compiled by World Bank. Based on the latest economic info provided for Low income.
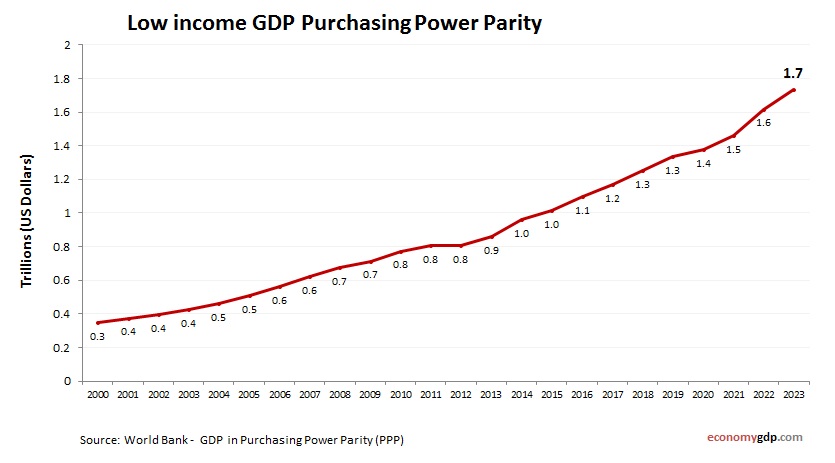
Low income economy graph showing purchasing power parity (PPP) growth from 2000 to today. Purchasing power parity adjusts the size of the economy to relevant price levels, i.e. measuring the price of specific goods in different countries and adjusting GDP View diagram Low income GDP Purchasing Power Parity

Low income GDP from 1990 to today. World Bank and OECD data. GDP in US dollars. Low-income economies exhibit limited GDP output, often relying heavily on agriculture and informal sectors. These economies face challenges such as limited infrastructure, low productivity, View diagram Low income GDP
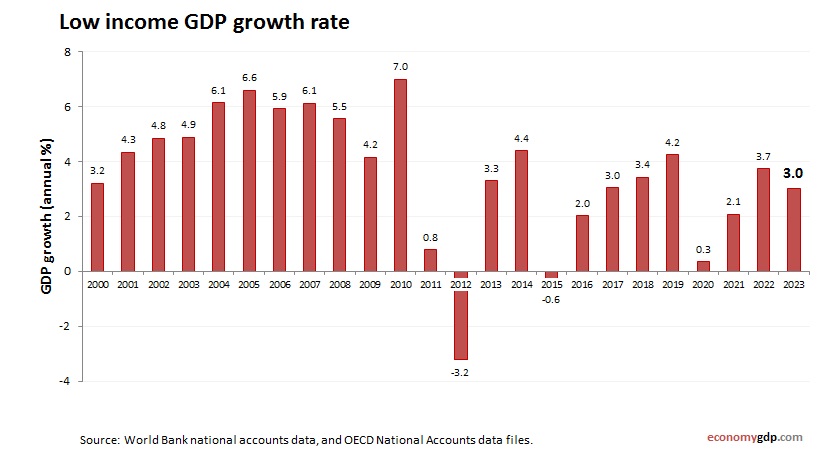
Low income economy annual growth rate from 2000 to today. GDP growth (yearly %). World Bank and OECD national accounts data. Low-income countries faced significant economic hurdles in 2023, with many experiencing subdued or negative GDP growth rates. Contributing factors View diagram Low income GDP growth rate
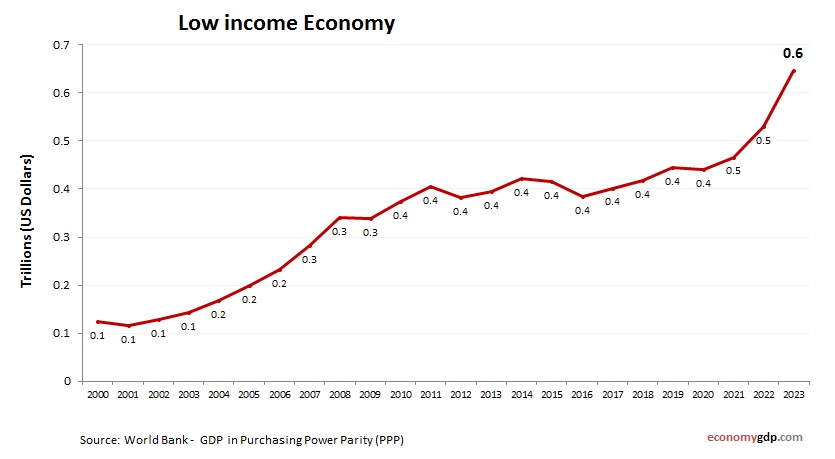
Low income economy growth from 2000 to today. GDP (current US$). World Bank and OECD national accounts data. Low-income economies are characterized by limited industrial activity, high poverty rates, and dependency on agriculture and foreign aid. These economies often struggle View diagram Low income Economy
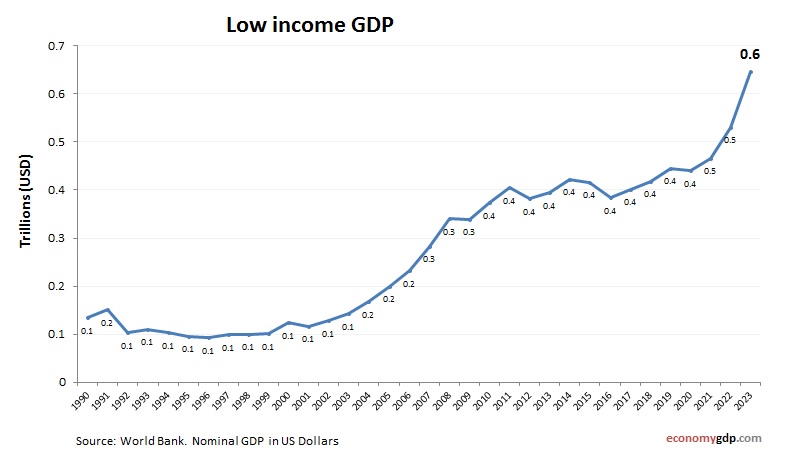
Low income GDP from 1990 to today. World Bank and OECD data. GDP in US dollars. Low-income GDP reflects limited economic output, often tied to primary sectors like agriculture. These countries face development constraints due to low productivity, political instability, View diagram Low income GDP