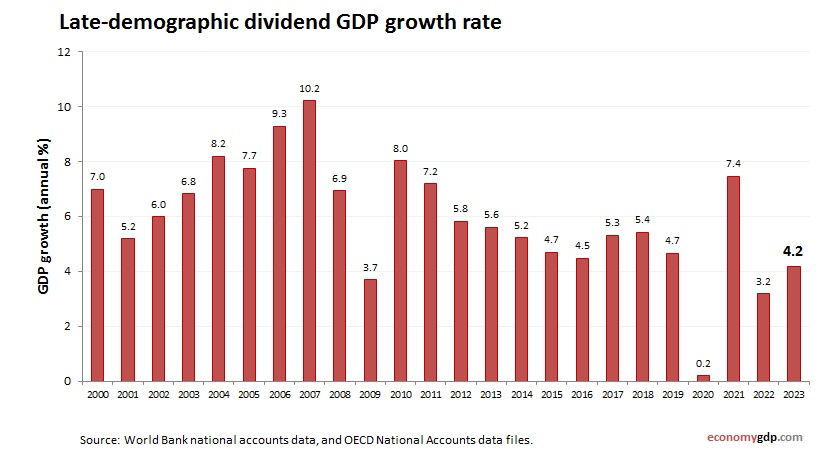
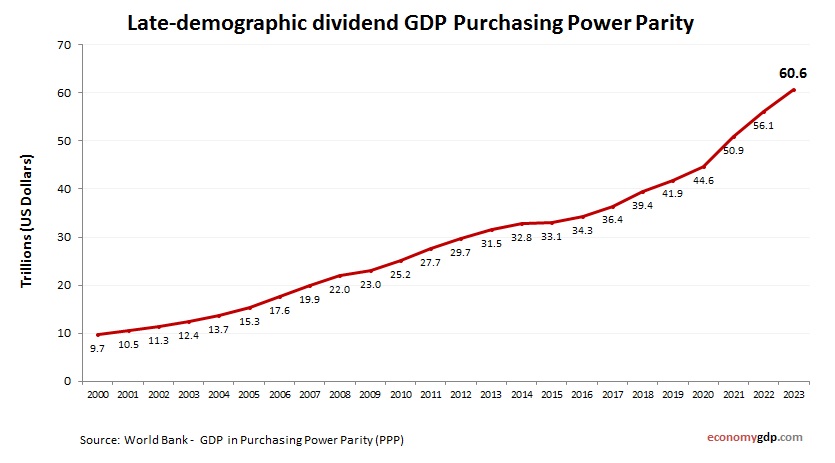
Late-demographic dividend GDP
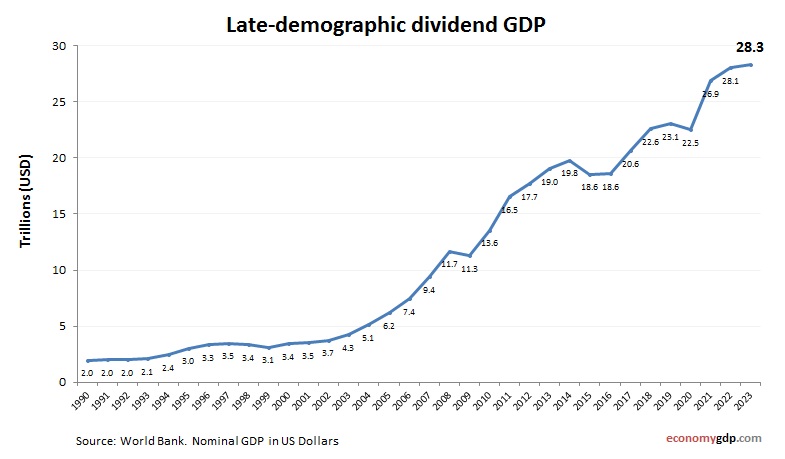
Late-demographic dividend GDP from 1990 to today. World Bank and OECD data. GDP in US dollars. Economies in this stage show slower population growth and rising elderly dependency. GDP growth is sustained through innovation, capital investment, and productivity gains rather View diagram Late-demographic dividend GDP