Skip to content
cropped-economygdp.jpg

Economy GDP

World economy charts, business frameworks and diagrams

Menu

Primary menu

  • Economy
    • Top Economies
  • Demographics
  • Business
    • Strategy
    • Project Management
    • Industry Examples
    • Leadership
    • HR
    • Industry Examples
  • Framework
  • Analysis
  • Lean Six Sigma
    • Lean
  • IT
    • Social Media
  • Marketing
  • Stories
  • Top

Tag Archives: Late-demographic dividend economy

Posts under this tag explore late-demographic dividend economies, featuring data and charts on GDP, PPP, and inflation that reflect evolving growth opportunities.

Late-demographic dividend Inflation

Late-demographic dividend Inflation

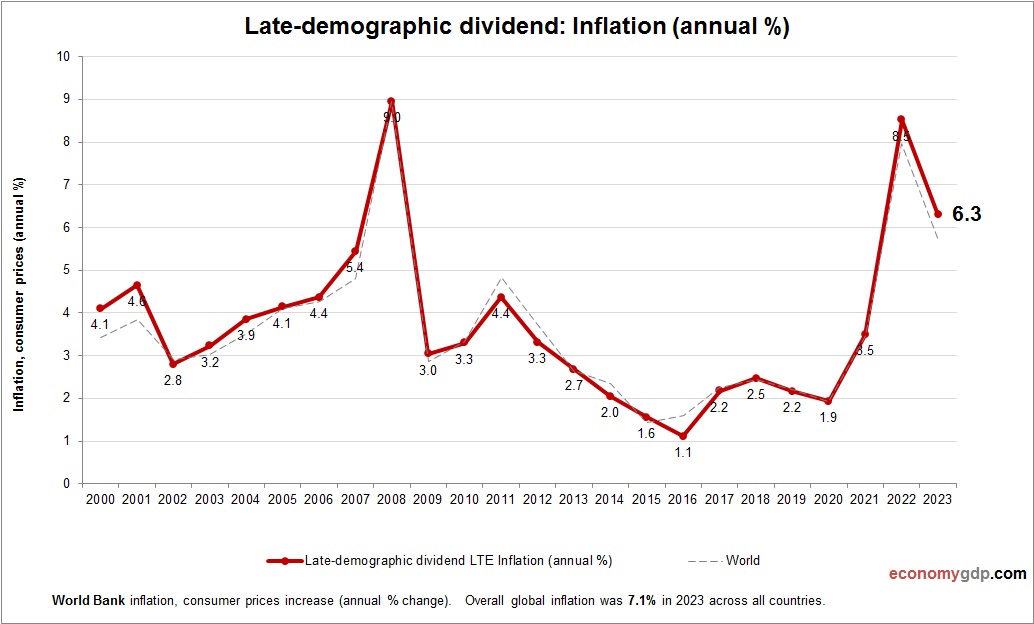
This graph shows Late-demographic dividend Inflation. The consumer price statistics are compiled by World Bank. Based on the latest economic data provided for Late-demographic dividend. In late-demographic dividend countries, inflation often arises from aging populations, slowing productivity, and growing fiscal View diagram Late-demographic dividend Inflation→

Posted in Economy | Tagged Late-demographic dividend economy

Late-demographic dividend GDP

Late-demographic dividend GDP

Late-demographic dividend GDP from 1990 to today. World Bank and OECD data. GDP in US dollars. Economies in this stage show slower population growth and rising elderly dependency. GDP growth is sustained through innovation, capital investment, and productivity gains rather View diagram Late-demographic dividend GDP→

Posted in Economy | Tagged Late-demographic dividend economy, Late-demographic dividend gdp

Late-demographic dividend GDP growth rate

Late-demographic dividend GDP growth rate

Late-demographic dividend economy annual growth rate from 2000 to today. GDP growth (yearly %). World Bank and OECD national accounts data. Countries in the late-demographic dividend phase grew around 3.2% in 2023. These economies are benefitting from a mature labor View diagram Late-demographic dividend GDP growth rate→

Posted in Economy | Tagged Late-demographic dividend economy, Late-demographic dividend gdp

Late-demographic dividend GDP Purchasing Power Parity

Late-demographic dividend GDP Purchasing Power Parity

Late-demographic dividend economy graph showing purchasing power parity (PPP) growth from 2000 to today. Purchasing power parity adjusts the size of the economy to relevant price levels, i.e. measuring the price of specific goods in different countries and adjusting GDP View diagram Late-demographic dividend GDP Purchasing Power Parity→

Posted in Economy | Tagged Late-demographic dividend economy, Late-demographic dividend gdp

Late-demographic dividend Economy

Late-demographic dividend Economy

Late-demographic dividend economy growth from 2000 to today. GDP (current US$). World Bank and OECD national accounts data. These economies are experiencing slower population growth and a shrinking working-age base. To maintain GDP growth, they focus on boosting productivity, innovation, View diagram Late-demographic dividend Economy→

Posted in Economy | Tagged Late-demographic dividend economy, Late-demographic dividend gdp

Primary Sidebar Widget Area

Top Diagrams

Latest Posts

  • Business Capabilities Model Explained
  • Paraguay GDP
  • Puerto Rico GDP per capita
  • Customer Segmentation Model
  • South Sudan GDP PPP
  • Paraguay GDP per capita
  • Tuvalu GDP per capita
  • Fraud Triangle
  • Togo GDP PPP
  • St. Kitts and Nevis GDP Purchasing Power Parity
  • AI Use Cases in Marketing Automation
  • Ukraine GDP
  • British East India Company 1600: Trade and Empire
  • Honduras Inflation
  • Macedonia GDP PPP
  • Twitter
Copyright © 2025 Economy GDP. All Rights Reserved.
Theme: Catch Box by Catch Themes
Scroll Up