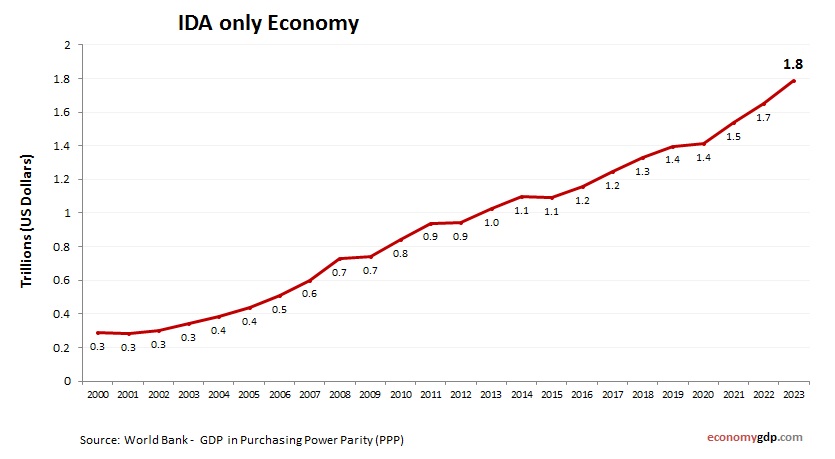
IDA only GDP growth rate

IDA only economy annual growth rate from 2000 to today. GDP growth (yearly %). World Bank and OECD national accounts data. IDA-only countries, typically among the poorest, had a growth rate of approximately 3.5% in 2023, driven by agriculture, aid, View diagram IDA only GDP growth rate