Skip to content
cropped-economygdp.jpg

Economy GDP

World economy charts, business frameworks and diagrams

Menu

Primary menu

  • Economy
    • Top Economies
  • Demographics
  • Business
    • Strategy
    • Project Management
    • Industry Examples
    • Leadership
    • HR
    • Industry Examples
  • Framework
  • Analysis
  • Lean Six Sigma
    • Lean
  • IT
    • Social Media
  • Marketing
  • Stories
  • Top

Tag Archives: Europe & Central Asia economy

This tag presents economic studies of Europe and Central Asia, highlighting GDP, PPP, and inflation data through engaging charts and visual comparisons.

Europe & Central Asia GDP per capita

Europe & Central Asia GDP per capita

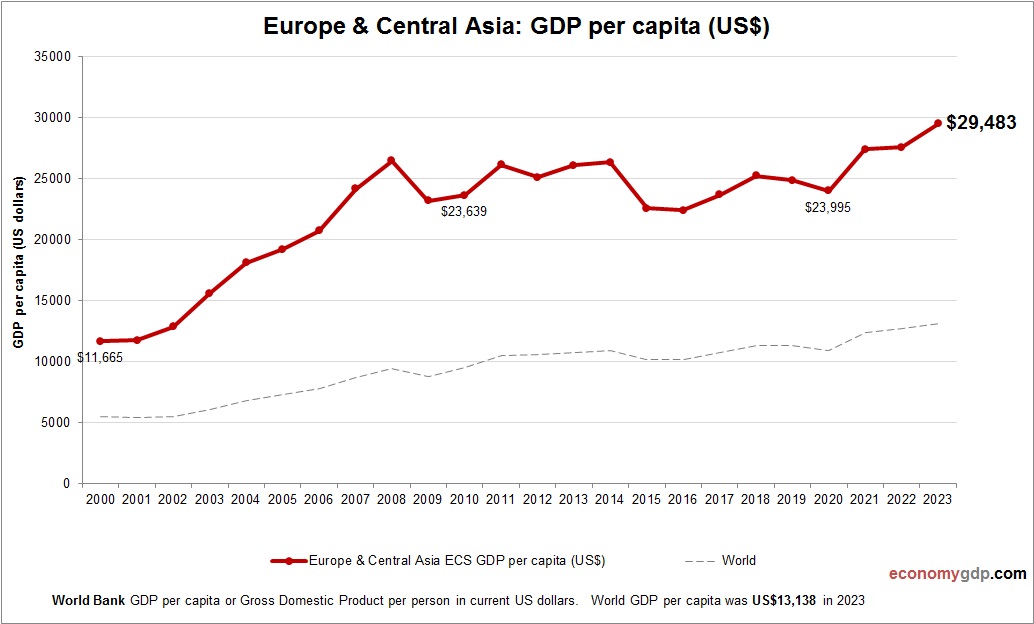
This chart demonstrates Europe & Central Asia GDP per capita. The economic data is provided by World Bank. Based on the latest available information for Europe & Central Asia. The Europe & Central Asia region displays a wide range of View diagram Europe & Central Asia GDP per capita→

Posted in Economy | Tagged Europe & Central Asia economy, Europe & Central Asia statistics

Europe & Central Asia Inflation

Europe & Central Asia Inflation

This chart demonstrates Europe & Central Asia Inflation. The consumer price statistics are compiled by World Bank. Based on the latest economic data provided for Europe & Central Asia. Inflation in Europe & Central Asia is shaped by energy market View diagram Europe & Central Asia Inflation→

Posted in Economy | Tagged Europe & Central Asia economy, Europe & Central Asia statistics

Europe and Central Asia GDP

Europe and Central Asia GDP

Europe and Central Asia GDP from 1990 to today. World Bank and OECD data. GDP in US dollars. This region’s GDP includes both high- and middle-income economies. Growth is supported by energy, manufacturing, and services, with increasing integration into global View diagram Europe and Central Asia GDP→

Posted in Economy | Tagged Europe & Central Asia economy

Europe and Central Asia Economy

Europe and Central Asia Economy

Europe and Central Asia economy growth from 2000 to today. GDP (current US$). World Bank and OECD national accounts data. This diverse region includes high- and middle-income economies. Growth is supported by trade, infrastructure, and industrial capacity, though geopolitical risks View diagram Europe and Central Asia Economy→

Posted in Economy | Tagged Europe & Central Asia economy

Primary Sidebar Widget Area

Top Diagrams

Latest Posts

  • Customer Segmentation Analysis Represented
  • Jamaica GDP
  • Customer Experience Management Clarified
  • Botswana GDP per capita
  • Steps of Research Methodology
  • Benin Inflation
  • Aruba Inflation
  • How AI Works
  • Cyprus Economy
  • Germany GDP per capita
  • Slovenia GDP Purchasing Power Parity
  • Romania Economy
  • Process Improvement Methodologies Model
  • Kiribati Economy
  • Corporate Fraud Risk Management
  • Twitter
Copyright © 2026 Economy GDP. All Rights Reserved.
Theme: Catch Box by Catch Themes
Scroll Up