Brazil GDP per capita
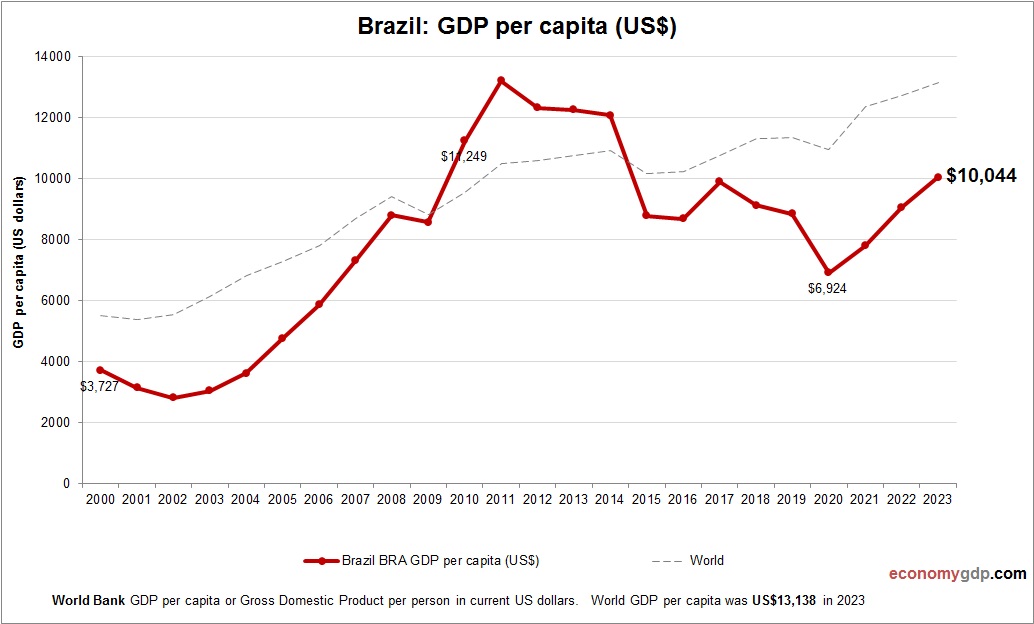
This chart demonstrates Brazil GDP per capita. This is according to World Bank GDP stats by country. Based on the latest available information for Brazil. Brazil, as the largest economy in Latin America, has a moderate GDP per capita. The View diagram Brazil GDP per capita