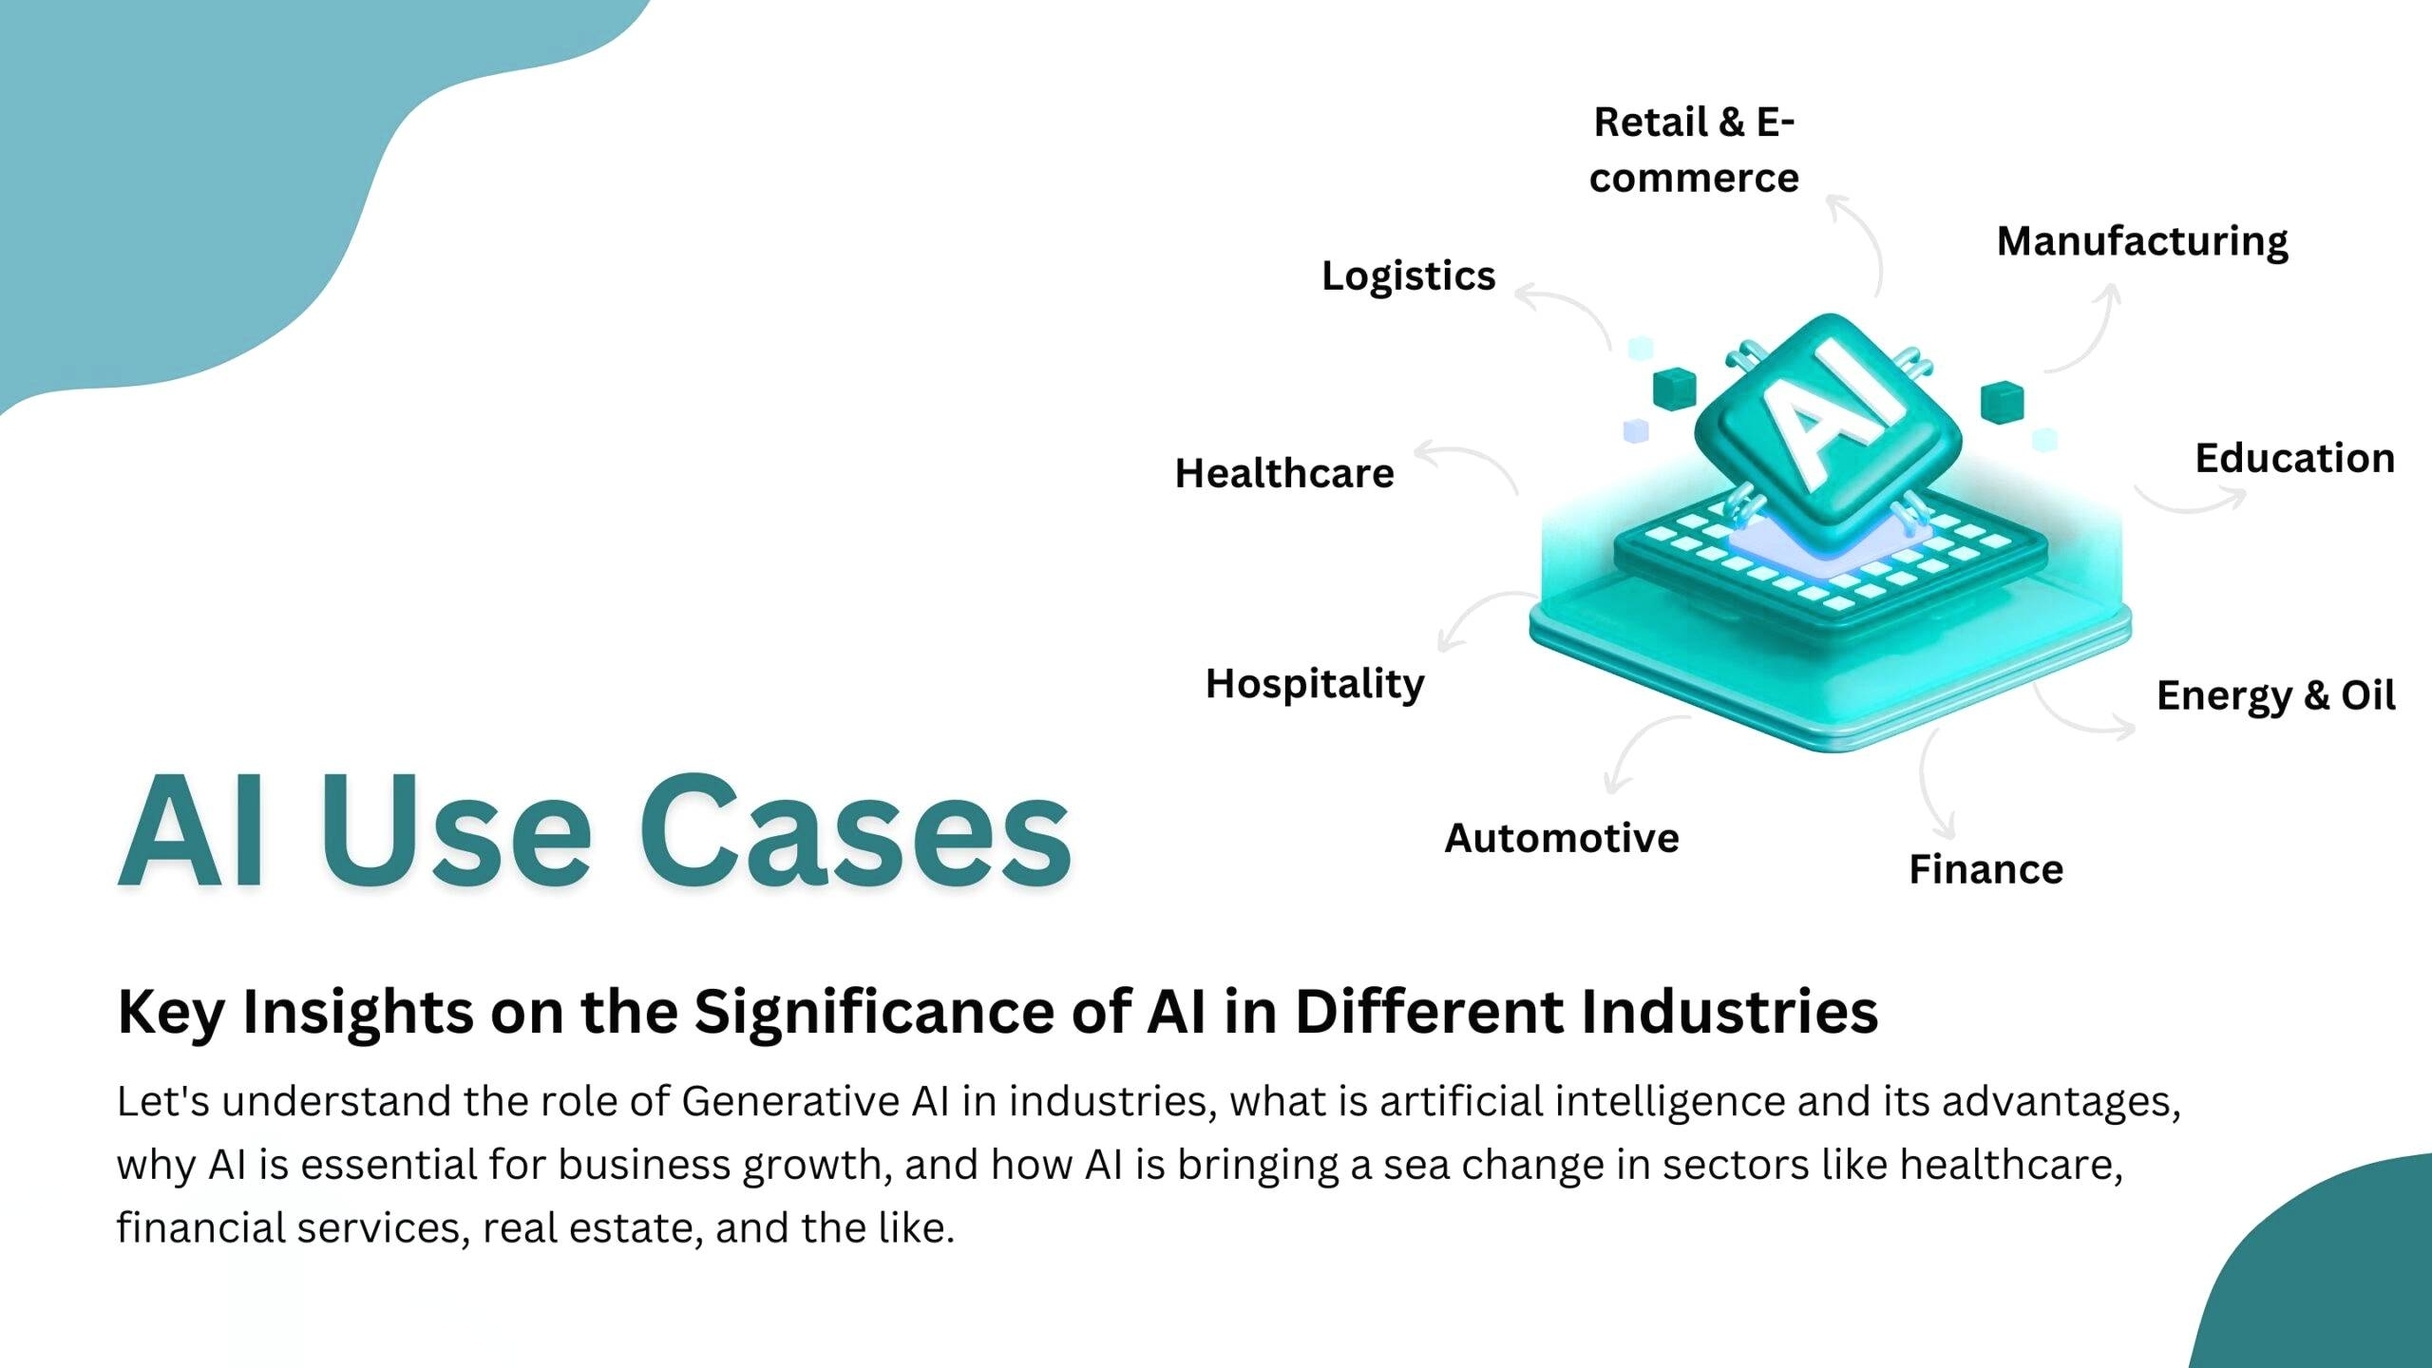
Skip to content
cropped-economygdp.jpg

Economy GDP

World economy charts, business frameworks and diagrams

Menu

Primary menu

  • Economy
    • Top Economies
  • Demographics
  • Business
    • Strategy
    • Project Management
    • Industry Examples
    • Leadership
    • HR
    • Industry Examples
  • Framework
  • Analysis
  • Lean Six Sigma
    • Lean
  • IT
    • Social Media
  • Marketing
  • Stories
  • Top

Category Archives: IT

Diagrams related to IT companies, digital business strategies and approaches

AI Use Cases Illustration

AI Use Cases Illustration

AI Use Cases Illustration: AI use cases illustration refers to visual representations of how artificial intelligence is applied in various industries and functions. These illustrations can depict AI-driven solutions in areas such as customer service (via chatbots), predictive analytics (in View diagram AI Use Cases Illustration→

Posted in IT | Tagged AI, AI diagram, AI explained, AI infographic, How does AI work

Salesforce Architecture Diagrams

Salesforce Architecture Diagrams

Salesforce Architecture Diagrams: Salesforce architecture diagrams provide a visual representation of how various Salesforce components and systems interact within an organization. These diagrams typically include key elements such as the Salesforce cloud, external systems, APIs, and the data flow between View diagram Salesforce Architecture Diagrams→

Posted in IT | Tagged CRM, Sales Force, SalesForce, SalesForce diagram, Salesforce technology

Steps in Agile Methodology Represented

Steps in Agile Methodology Represented

Steps in Agile Methodology Represented: Agile methodology focuses on iterative development and continuous improvement. The steps in the Agile process typically include planning, designing, coding, testing, reviewing, and releasing a product in short cycles called sprints. The methodology emphasizes collaboration, View diagram Steps in Agile Methodology Represented→

Posted in IT | Tagged agile, agile project

AI Use Cases for Health Equity

AI Use Cases for Health Equity

AI Use Cases for Health Equity: AI use cases for health equity focus on leveraging artificial intelligence to address disparities in healthcare access, outcomes, and treatment. Examples include using AI to predict disease outbreaks in underserved populations, improving diagnostic accuracy View diagram AI Use Cases for Health Equity→

Posted in IT | Tagged AI, AI diagram, AI explained, AI infographic, How does AI work

Steps in Agile Methodology Explained

Steps in Agile Methodology Explained

Steps in Agile Methodology Explained: The steps in Agile methodology include a series of iterative processes aimed at delivering small, incremental improvements in projects. Key steps include planning, where the team defines goals; development, where features are built and tested; View diagram Steps in Agile Methodology Explained→

Posted in IT | Tagged agile, agile project

Salesforce System Landscape Diagram

Salesforce System Landscape Diagram

Salesforce System Landscape Diagram: A Salesforce system landscape diagram is a visual representation that illustrates how different components of Salesforce, such as Sales Cloud, Service Cloud, Marketing Cloud, and other third-party systems, interact within an organization’s IT infrastructure. This diagram View diagram Salesforce System Landscape Diagram→

Posted in IT | Tagged CRM, Sales Force, SalesForce, SalesForce diagram, Salesforce technology

Digital Strategy Enables and Business Model

Digital Strategy Enables and Business Model

The below digital strategy diagram depicts how digital strategy (company vision, industry trends) is connected to business model (customer and channel, products and services), enablers (data, IT systems, processes, people) and orchestration (executive sponsors, governance, funding). This diagram explains the View diagram Digital Strategy Enables and Business Model→

Posted in IT | Tagged digital strategy

Social business strategy

Social business strategy

Social business strategy framework below lists all the key components of a successful social business including goals, vision, getting executive support, strategy, guidelines, staff, investing in technology. Social business strategy like any strategy requires planning and aligning your strategy with View diagram Social business strategy→

Posted in Social Media | Tagged social business, social business diagram

Digital Transformation Approach

Digital Transformation Approach

Digital transformation strategy framework below shows the typical stages of digital transformation including strategy and business case, current state, future state, roadmap, implementation and monitoring of the results. The below diagram also includes details on key components of each of View diagram Digital Transformation Approach→

Posted in IT | Tagged business transformation

Digital Strategy Framework as Compared to Online, Business and IT strategies.

Digital Strategy Framework as Compared to Online, Business and IT strategies.

This digital strategy framework shows how Digital strategy fits in between your Online, Business and IT strategies, how it different from the others but ultimately ties things together. It is holistic approach to your internal and external digital capabilities.

Posted in Business, IT | Tagged digital, digital strategy, digital strategy diagram, digital strategy framework, IT, IT strategy, IT strategy framework

Post navigation

← Older posts
Newer posts →

Primary Sidebar Widget Area

Top Diagrams

Latest Posts

  • Business Capabilities Model Explained
  • Paraguay GDP
  • Puerto Rico GDP per capita
  • Customer Segmentation Model
  • South Sudan GDP PPP
  • Paraguay GDP per capita
  • Tuvalu GDP per capita
  • Fraud Triangle
  • Togo GDP PPP
  • St. Kitts and Nevis GDP Purchasing Power Parity
  • AI Use Cases in Marketing Automation
  • Ukraine GDP
  • British East India Company 1600: Trade and Empire
  • Honduras Inflation
  • Macedonia GDP PPP
  • Twitter
Copyright © 2025 Economy GDP. All Rights Reserved.
Theme: Catch Box by Catch Themes
Scroll Up