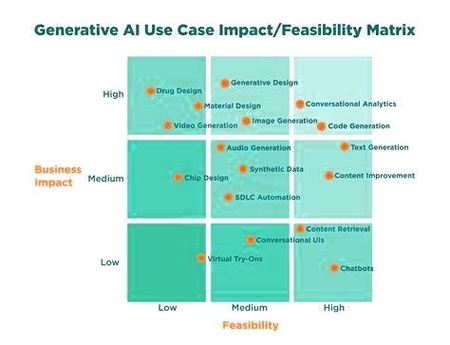
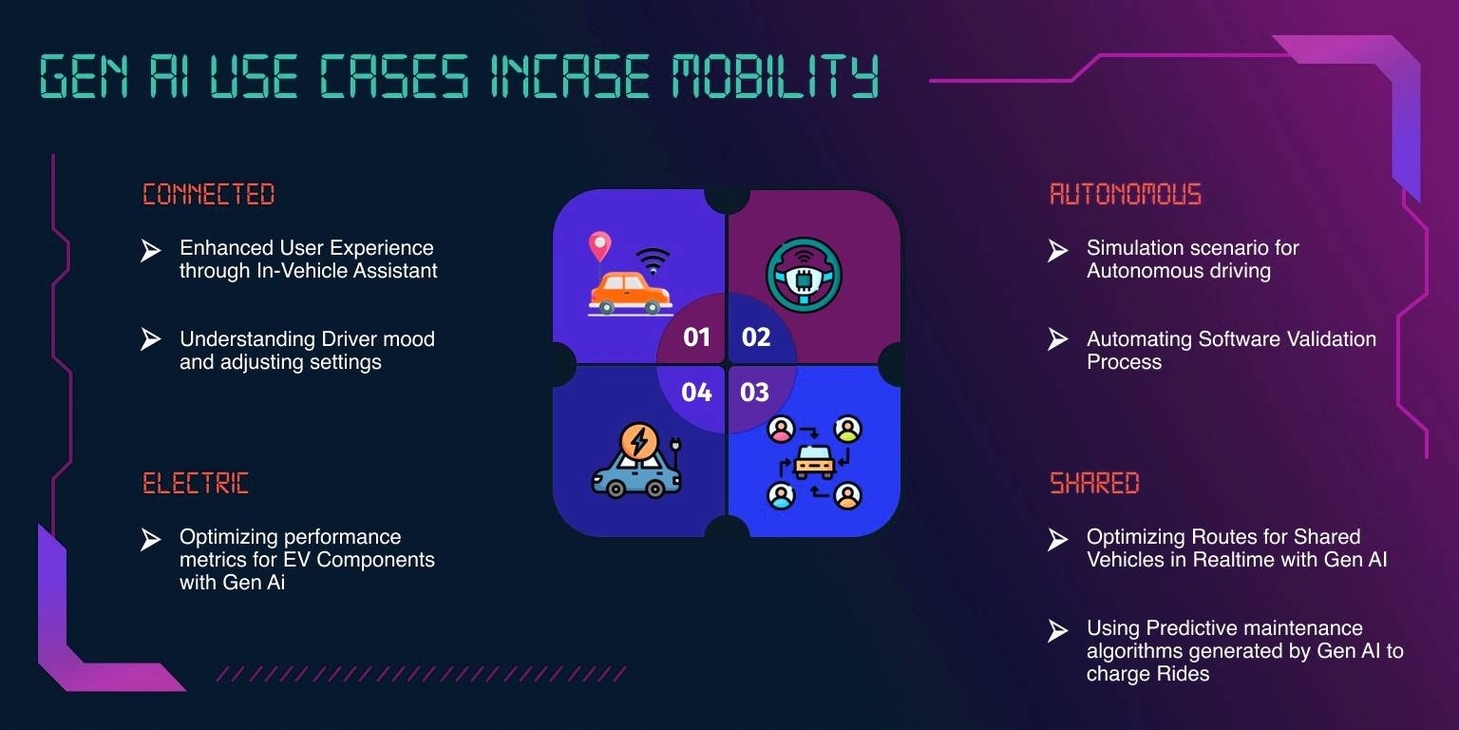
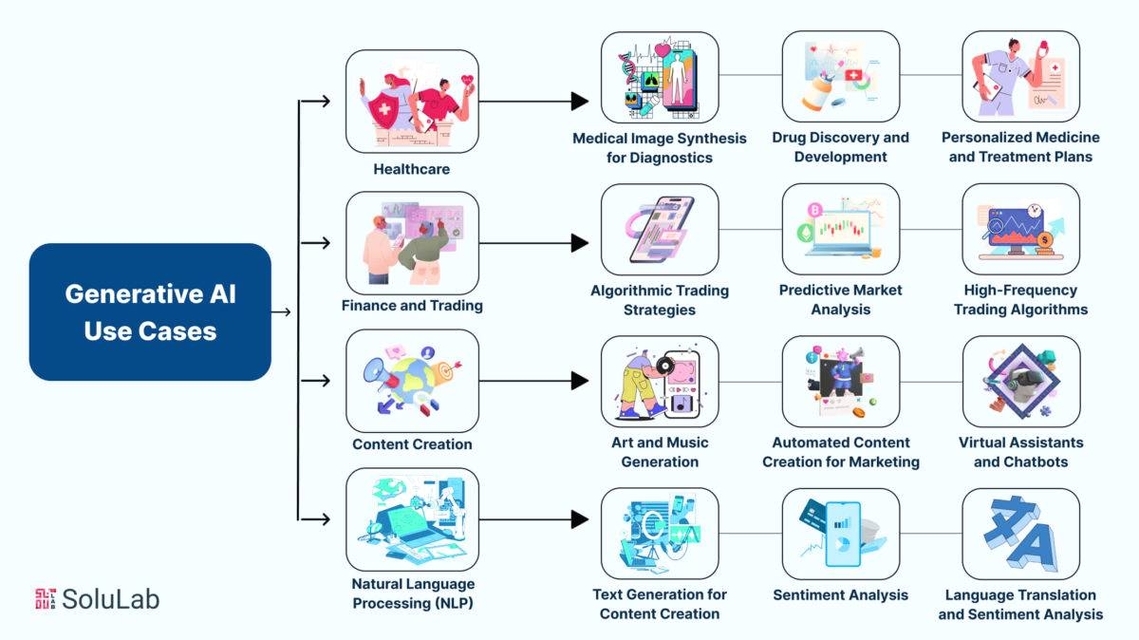
Generative AI Use Cases in Different Industries
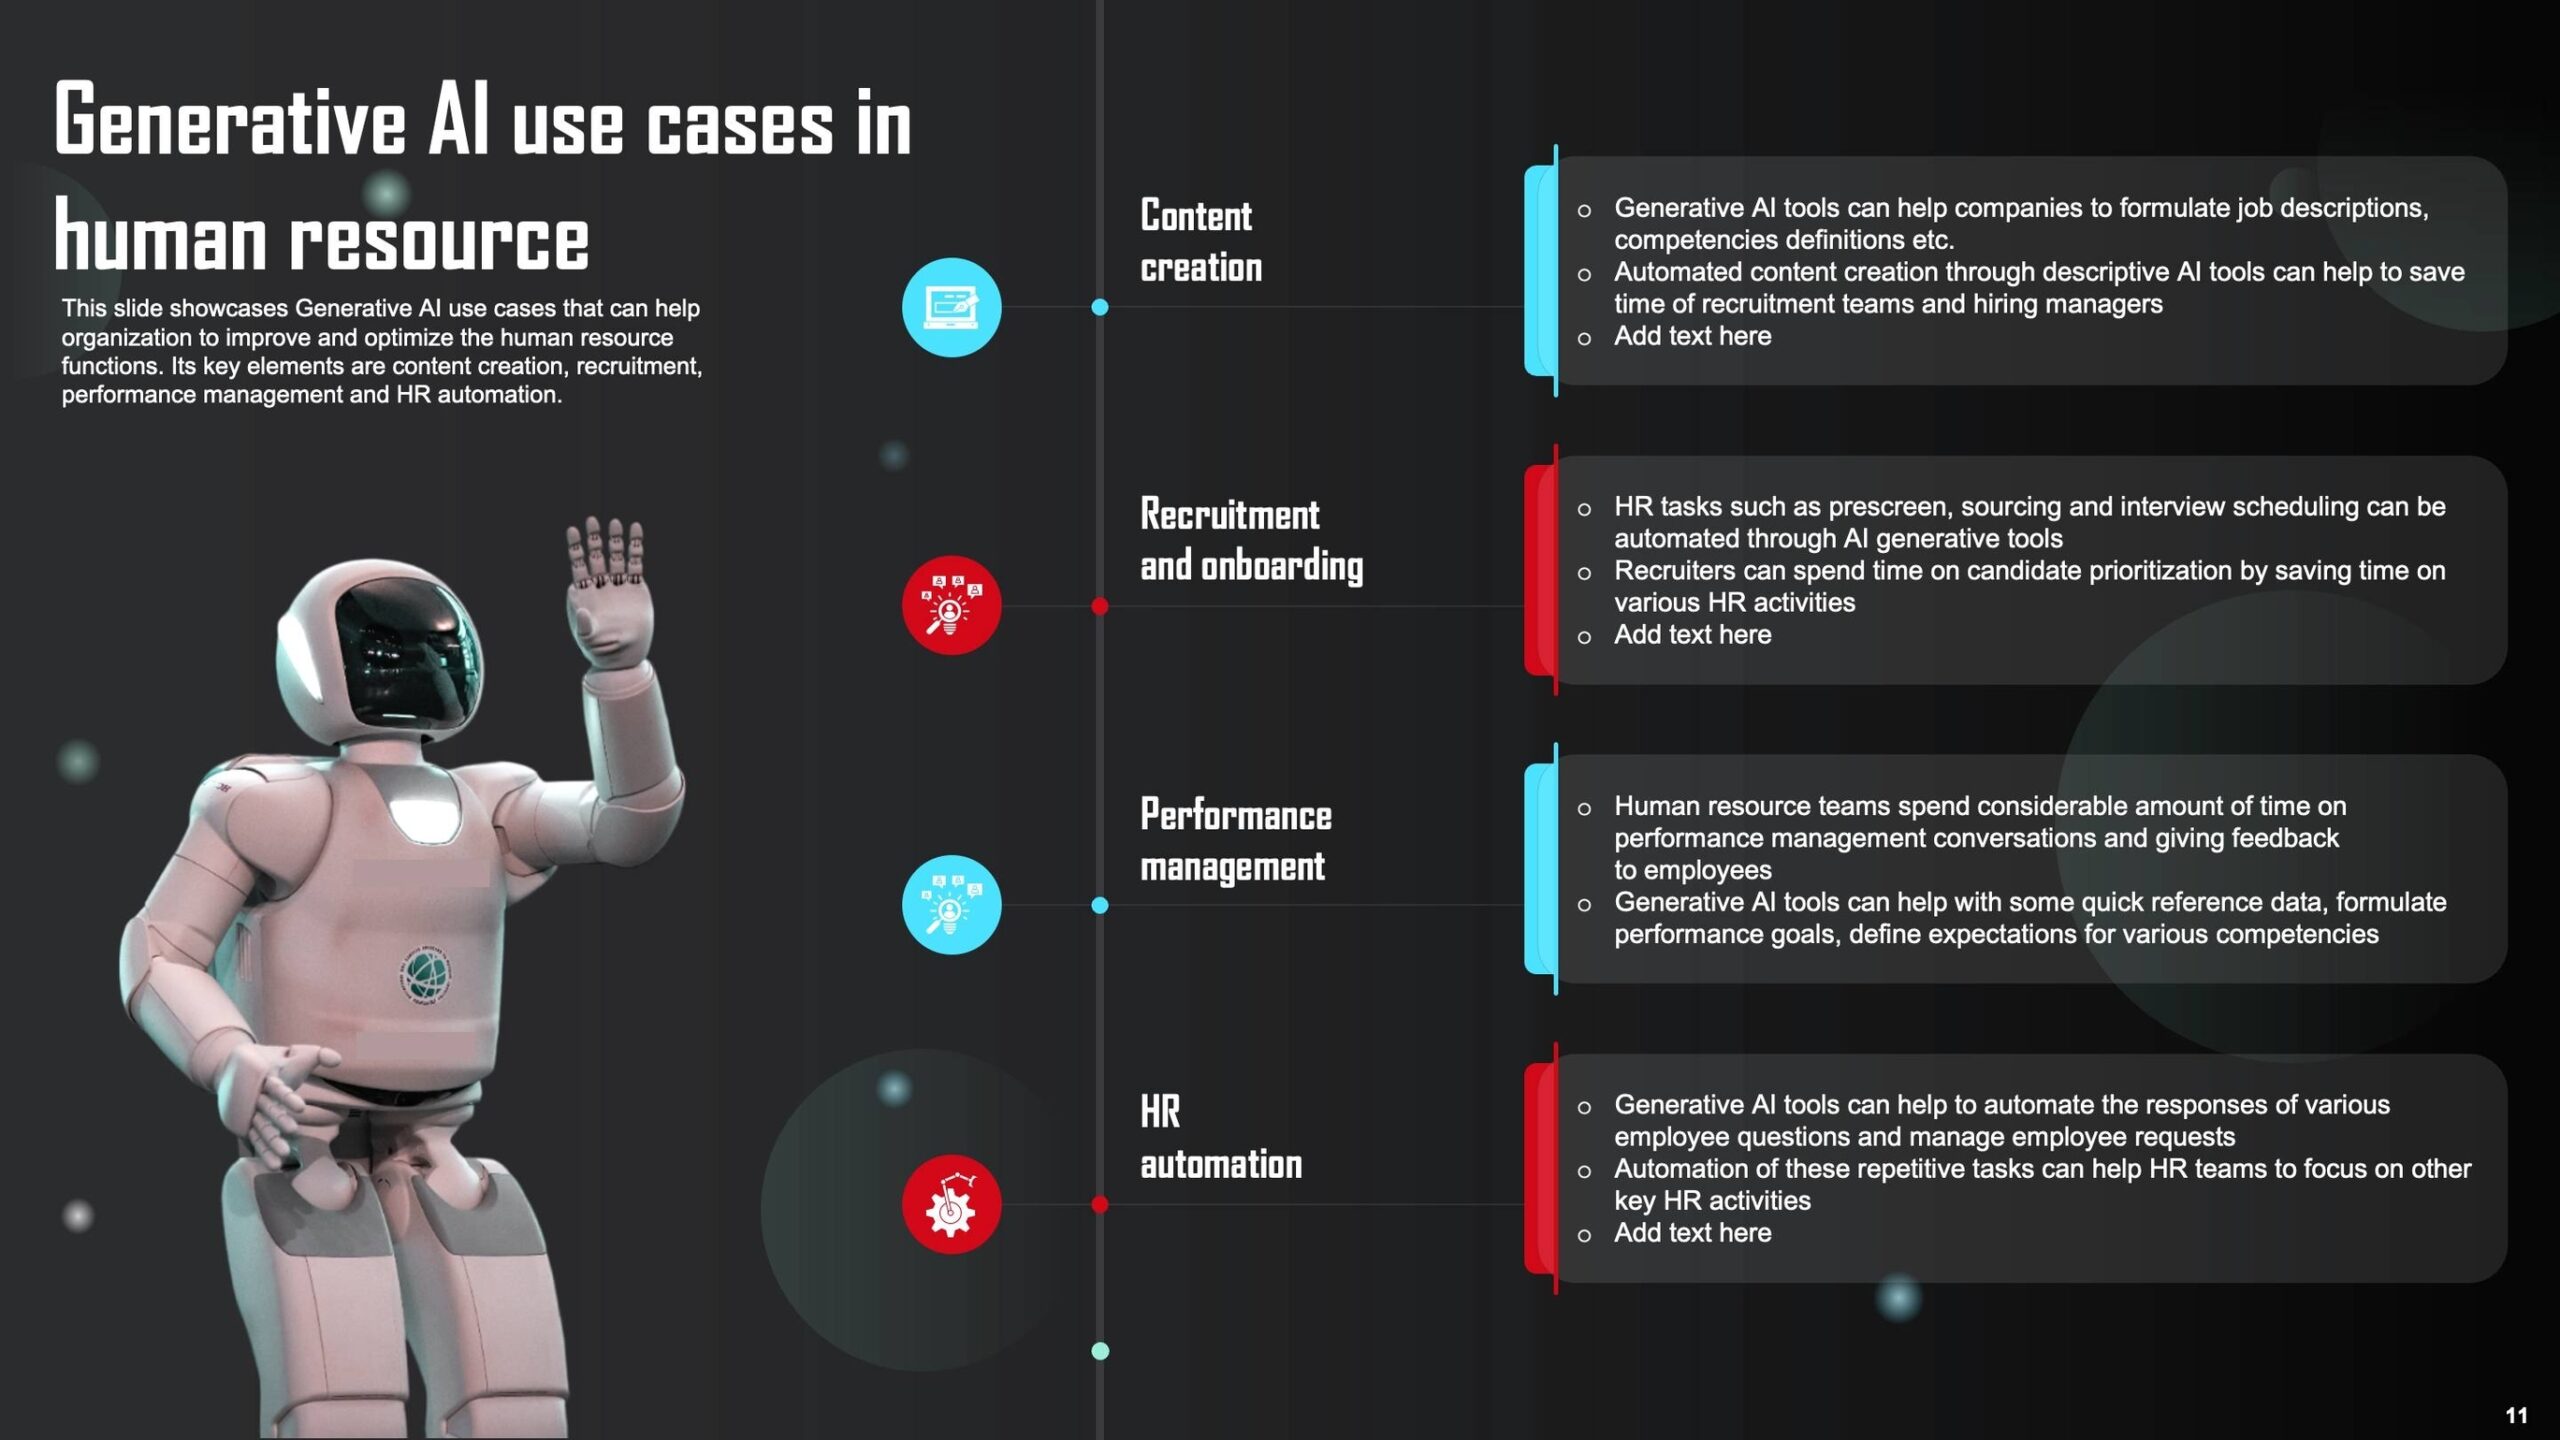
Generative AI Use Cases in Different Industries: Generative AI use cases across different industries include creating personalized marketing content in advertising, generating synthetic data for training models in healthcare, designing new products in manufacturing, and assisting with content creation in View diagram Generative AI Use Cases in Different Industries