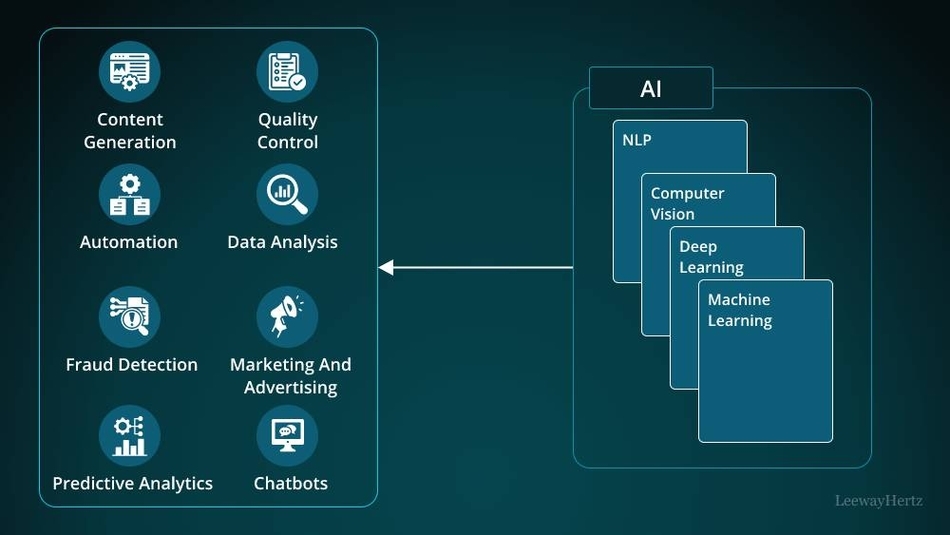
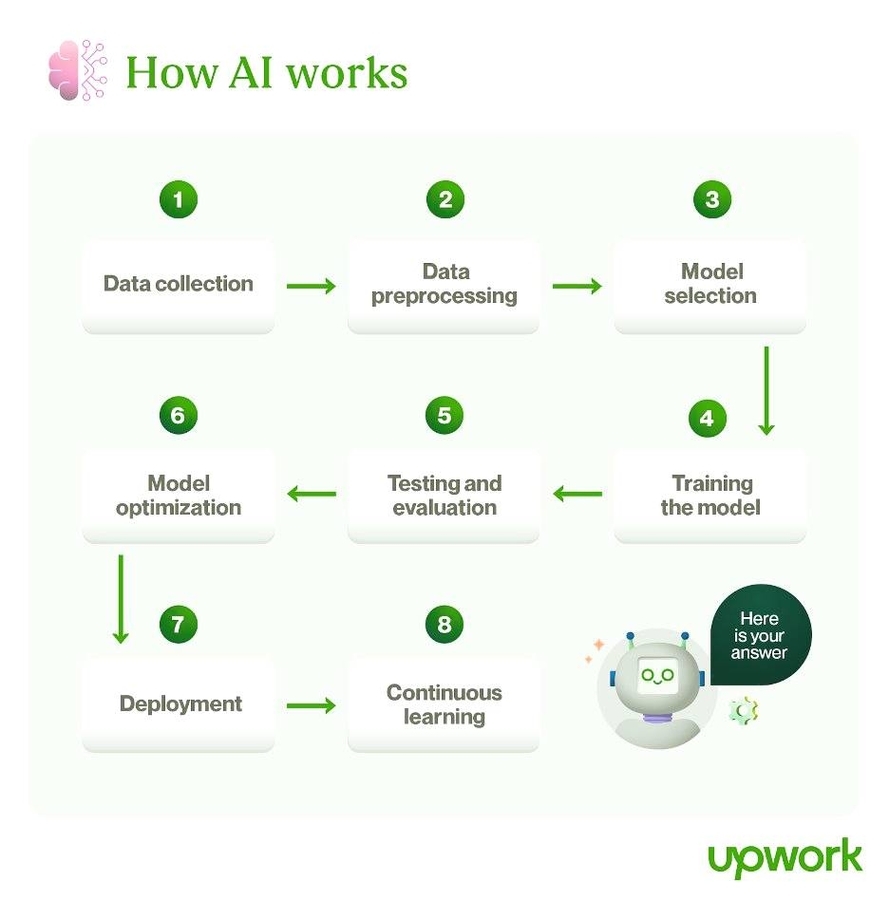
Skip to content
cropped-economygdp.jpg

Economy GDP

World economy charts, business frameworks and diagrams

Menu

Primary menu

  • Economy
    • Top Economies
  • Demographics
  • Business
    • Strategy
    • Project Management
    • Industry Examples
    • Leadership
    • HR
    • Industry Examples
  • Framework
  • Analysis
  • Lean Six Sigma
    • Lean
  • IT
    • Social Media
  • Marketing
  • Stories
  • Top

Category Archives: IT

Diagrams related to IT companies, digital business strategies and approaches

GenAI Use Cases

GenAI Use Cases

GenAI Use Cases: GenAI use cases refer to the various ways generative artificial intelligence can be applied across different sectors. These applications include generating content such as text, images, and music, automating product design, enhancing customer service with chatbots, and View diagram GenAI Use Cases→

Posted in IT | Tagged AI, AI diagram, AI explained, AI infographic, How does AI work

Gen AI Use Cases Sample

Gen AI Use Cases Sample

Gen AI Use Cases Sample: A sample of generative AI use cases includes automated content generation for social media, personalized product recommendations in e-commerce, drug discovery in pharmaceuticals, and synthetic data generation for training AI models. These use cases illustrate View diagram Gen AI Use Cases Sample→

Posted in IT | Tagged AI, AI diagram, AI explained, AI infographic, How does AI work

Generative AI Use Cases Representation

Generative AI Use Cases Representation

Generative AI Use Cases Representation: Generative AI use cases representation refers to the visual or descriptive illustration of how generative artificial intelligence can be applied across different industries and functions. Examples include content creation, product design, synthetic data generation, and View diagram Generative AI Use Cases Representation→

Posted in IT | Tagged AI, AI diagram, AI explained, AI infographic, How does AI work

Salesforce Product Catalog

Salesforce Product Catalog

Salesforce Product Catalog: The Salesforce Product Catalog is a centralized repository within Salesforce where all the products, services, and pricing information are stored. It helps sales teams and customers easily access and view products and configure solutions based on their View diagram Salesforce Product Catalog→

Posted in IT | Tagged CRM, Sales Force, SalesForce, SalesForce diagram, Salesforce technology

Gen AI Use Cases Explained

Gen AI Use Cases Explained

Gen AI Use Cases Explained: Gen AI use cases refer to various applications of generative artificial intelligence technologies in different industries. These include automating content creation, generating realistic images and videos, producing synthetic data for training models, creating personalized customer View diagram Gen AI Use Cases Explained→

Posted in IT | Tagged AI, AI diagram, AI explained, AI infographic, How does AI work

Salesforce CRM Diagram

Salesforce CRM Diagram

Salesforce CRM Diagram: A Salesforce CRM diagram visually represents the architecture and components of Salesforce’s customer relationship management system. It includes key features such as lead management, sales processes, customer service tools, and analytics. The diagram helps businesses understand how View diagram Salesforce CRM Diagram→

Posted in IT | Tagged CRM, Sales Force, SalesForce, SalesForce diagram, Salesforce technology

Gen AI Use Cases

Gen AI Use Cases

Gen AI Use Cases: Generative AI use cases are diverse and extend across industries such as healthcare, entertainment, and marketing. In healthcare, Gen AI is used to simulate drug molecules and predict medical outcomes. In marketing, it generates personalized content View diagram Gen AI Use Cases→

Posted in IT | Tagged AI, AI diagram, AI explained, AI infographic, How does AI work

Gen AI Use Cases

Gen AI Use Cases

Gen AI Use Cases: Gen AI use cases refer to specific applications of generative artificial intelligence in various industries, such as creating synthetic data, automating content creation, designing products, and enhancing customer interactions. These use cases illustrate the versatility of View diagram Gen AI Use Cases→

Posted in IT | Tagged AI, AI diagram, AI explained, AI infographic, How does AI work

Salesforce ERD Diagram Examined

Salesforce ERD Diagram Examined

Salesforce ERD Diagram Examined: The Salesforce Entity Relationship Diagram (ERD) is a visual representation of the relationships between different data entities within Salesforce. This diagram shows how objects like Accounts, Contacts, Opportunities, and Leads are related, helping users understand the View diagram Salesforce ERD Diagram Examined→

Posted in IT | Tagged CRM, Sales Force, SalesForce, SalesForce diagram, Salesforce technology

Gen AI Use Cases Definition

Gen AI Use Cases Definition

Gen AI Use Cases Definition: Gen AI use cases definition refers to the various applications of generative artificial intelligence across different industries and sectors. These use cases include automating content creation, generating synthetic data, enhancing customer service with chatbots, and View diagram Gen AI Use Cases Definition→

Posted in IT | Tagged AI, AI diagram, AI explained, AI infographic, How does AI work

Post navigation

← Older posts
Newer posts →

Primary Sidebar Widget Area

Top Diagrams

Latest Posts

  • Cayman Islands Fertility Rate
  • Papua New Guinea Children Per woman
  • Business Model Framework Illustration
  • Brazil GDP per capita
  • Madagascar Fertility Rate
  • Costa Rica Inflation
  • Australia Inflation
  • Tajikistan Economy in Graphs
  • United States Fertility Rate
  • Nicaragua GDP PPP
  • Guatemala GDP PPP
  • Sweden GDP per capita
  • Lesotho GDP PPP
  • Change Management Methodology PowerPoint Presentation
  • Example of an Issue Analysis Framework
  • Twitter
Copyright © 2026 Economy GDP. All Rights Reserved.
Theme: Catch Box by Catch Themes
Scroll Up