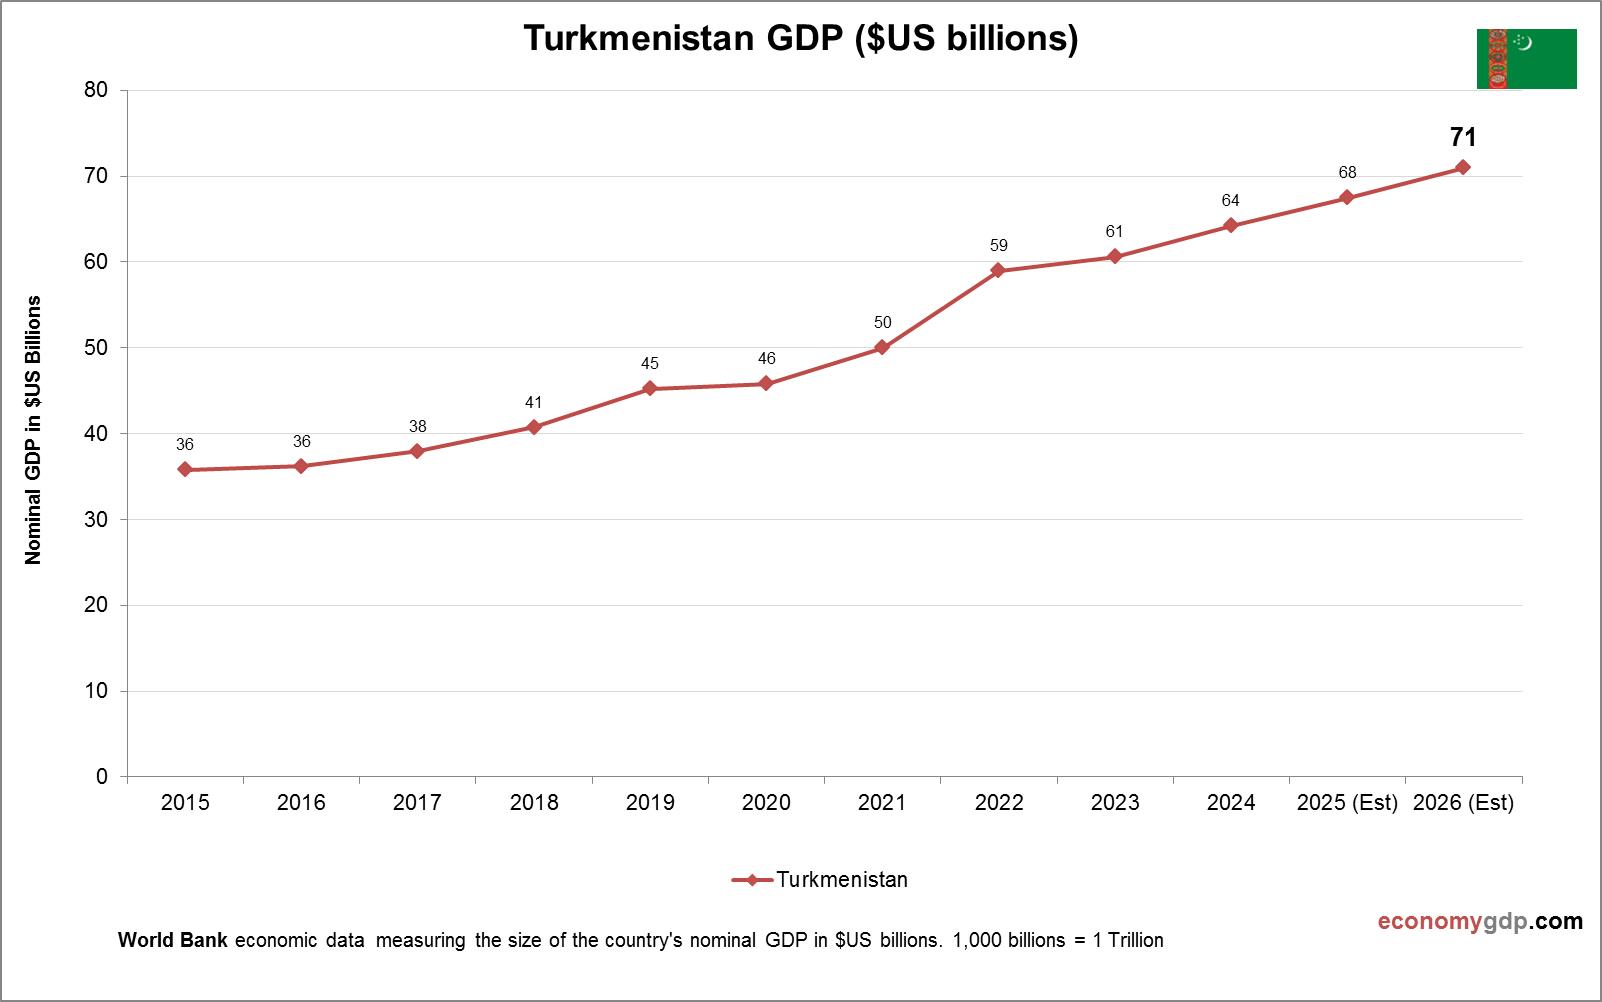
This diagram presents Venezuela Inflation. This is according to World Bank consumer price index stats by country. Change in consumer prices for Venezuela.
This chart demonstrates Uruguay Inflation. This is according to World Bank consumer price index stats by country. Based on the latest available information for Uruguay.
This graph shows Sub-Saharan Africa (excluding high income) Inflation. Inflation data is sourced from World Bank. Change in consumer prices for Sub-Saharan Africa (excluding high income).
This chart demonstrates Denmark Inflation. This is according to World Bank consumer price index stats by country. Change in consumer prices for Denmark.
This chart demonstrates West Bank and Gaza GDP per capita. The economic data is provided by World Bank. Based on the latest economic info provided for West Bank and Gaza.
This graph shows Madagascar Inflation. The consumer price statistics are compiled by World Bank. Based on the latest economic data provided for Madagascar.