Belize GDP per capita
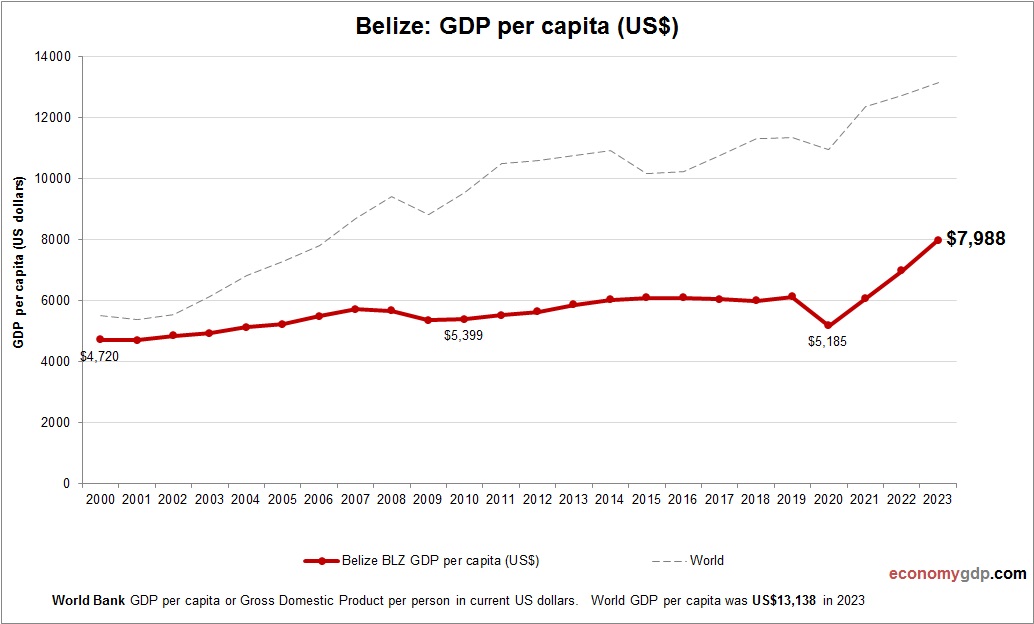
This diagram presents Belize GDP per capita. This is according to World Bank GDP stats by country. Based on the latest economic info provided for Belize. Belize’s GDP per capita is moderate, with the economy primarily based on tourism, agriculture, View diagram Belize GDP per capita