
Sri Lanka's GDP is based on agriculture, textiles, tourism, and services. Tea, rubber, and coconut remain export staples, while garments dominate manufacturing. Tourism, with its beaches and cultural sites, adds significant foreign exchange. The services sector, including IT and financial services, is growing steadily. However, the economy has faced debt challenges, inflation, and political instability, affecting GDP growth. Recovery efforts focus on debt restructuring, investment in technology, and expanding exports. Sri Lanka's strategic location along key shipping routes gives it long-term potential for trade-driven growth despite current economic pressures.
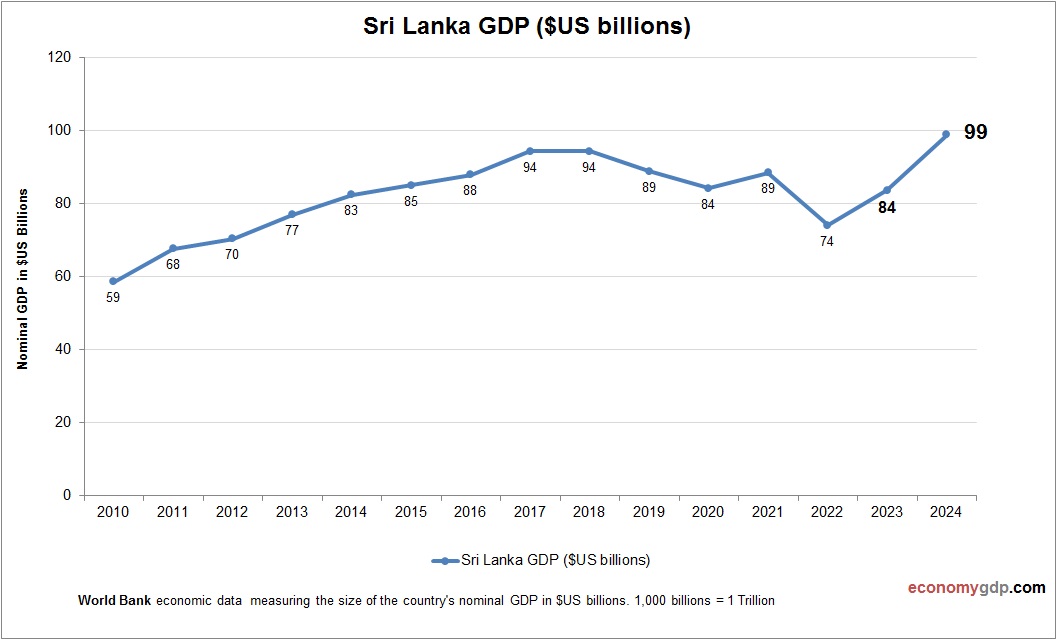
World Bank GDP economic data: 2010-2024. Last updated Apr 2026. See Sri Lanka GDP per capita.
Sri Lanka GDP Statistics by Year
| Year | GDP Size (in billions $) |
| 2025 (projected) | 105 |
| 2024 | 99 |
| 2023 | 84 |
| 2022 | 74 |
| 2021 | 89 |
| 2020 | 84 |
| 2019 | 89 |
| 2018 | 94 |
| 2017 | 94 |
| 2016 | 88 |
| 2015 | 85 |
| 2014 | 83 |
| 2013 | 77 |
| 2012 | 70 |
| 2011 | 68 |
| 2010 | 59 |