
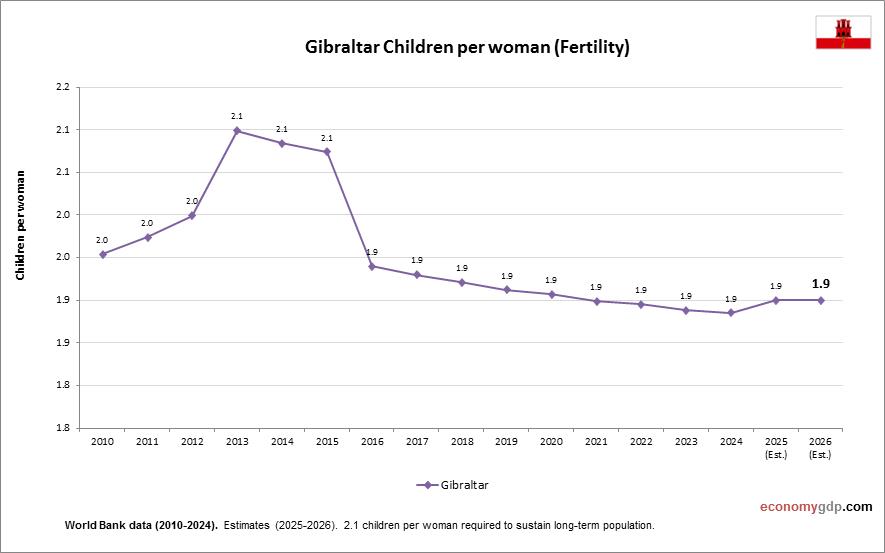
The above graph shows Gibraltar Children Per woman. World Bank is the source of this birth data. Based on the latest available information for Gibraltar.
Women in Gibraltar average fewer than two children, consistent with European low fertility patterns.
Gibraltar Children Per woman (Fertility Rate) Statistics by Year
| Year | Children per woman (fertility rate) |
| 2000 | 2.19 |
| 2001 | 2.10 |
| 2002 | 1.68 |
| 2003 | 1.63 |
| 2004 | 1.69 |
| 2005 | 1.75 |
| 2006 | 1.80 |
| 2007 | 1.85 |
| 2008 | 1.90 |
| 2009 | 1.93 |
| 2010 | 1.95 |
| 2011 | 1.97 |
| 2012 | 2.0 |
| 2013 | 2.10 |
| 2014 | 2.08 |
| 2015 | 2.07 |
| 2016 | 1.94 |
| 2017 | 1.93 |
| 2018 | 1.92 |
| 2019 | 1.91 |
| 2020 | 1.91 |
| 2021 | 1.90 |
| 2022 | 1.90 |
| 2023 | 1.89 |
| 2024 | 1.89 |
| 2025 (Est.) | 1.90 |
| 2026 (Est.) | 1.90 |