
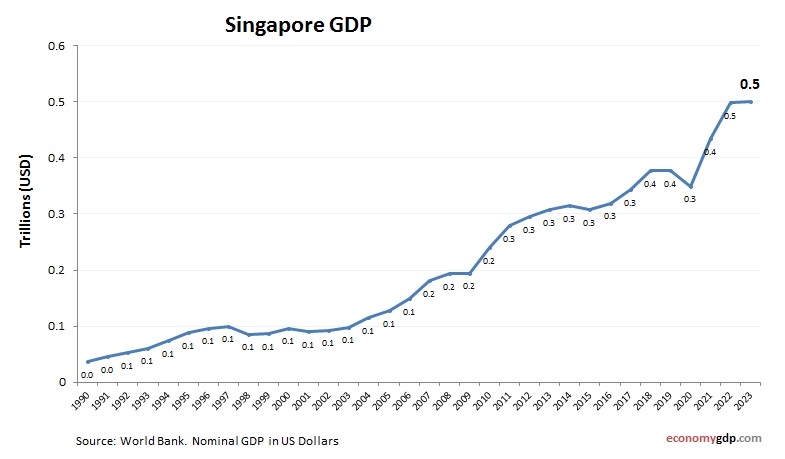
Singapore GDP from 2010 to today. World Bank and OECD data. GDP in US dollars. Singapore has one of the world's most competitive economies, with GDP powered by finance, trade, technology, and advanced manufacturing. Its strategic location makes it a global hub for shipping and logistics, while world-class infrastructure attracts investment. Electronics, pharmaceuticals, and petrochemicals are key exports, complemented by a robust services sector that includes finance, tourism, and digital industries. Singapore consistently ranks high in innovation and ease of doing business. Despite its small size, its high GDP per capita reflects advanced productivity and wealth. Future growth focuses on green technology, biotech, and digital transformation.
Singapore GDP Statistics by Year
| Year | GDP Size (in billions $) |
| 2025 (projected) | 565 |
| 2024 | 547 |
| 2023 | 505 |
| 2022 | 509 |
| 2021 | 437 |
| 2020 | 349 |
| 2019 | 376 |
| 2018 | 377 |
| 2017 | 344 |
| 2016 | 320 |
| 2015 | 308 |
| 2014 | 315 |
| 2013 | 308 |
| 2012 | 295 |
| 2011 | 279 |
| 2010 | 240 |