
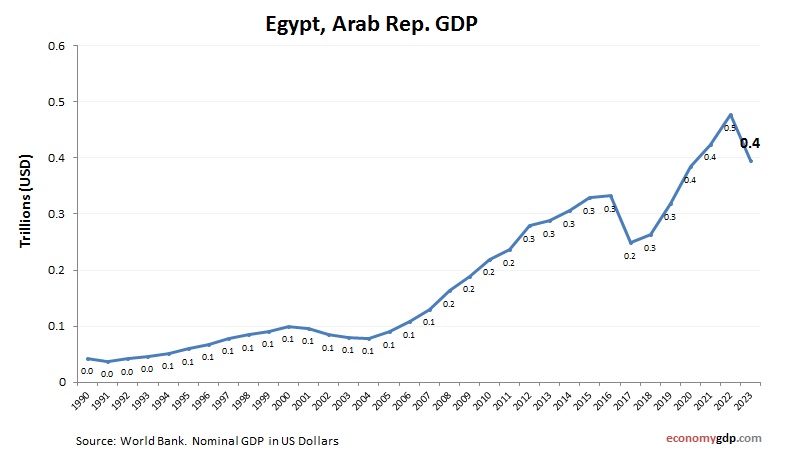
Egypt GDP from 2010 to today. World Bank and OECD data. GDP in US dollars. Egypt's robust $404 billion economy, projected to grow 4.0% in 2025, hinges on tourism, Suez Canal revenues, and agriculture, with per capita GDP reaching $3,800. Natural gas exports are surging, yet food imports strain trade balances, exacerbated by 20% inflation and a 90% debt-to-GDP ratio. Recent IMF-backed reforms and expansive solar energy projects aim to stabilize finances and create jobs. With 110 million people, Egypt invests heavily in tech hubs and infrastructure along the Nile, seeking to diversify into manufacturing and digital services. Its strategic location near the Middle East and Africa offers trade advantages, though water scarcity and regional instability pose risks. The nation targets poverty reduction and sustainable growth through innovation and resilience. See Egypt GDP per capita.
Egypt GDP Statistics by Year
| Year | GDP Size (in billions $) |
| 2025 (projected) | 400 |
| 2024 | 389 |
| 2023 | 396 |
| 2022 | 477 |
| 2021 | 425 |
| 2020 | 384 |
| 2019 | 319 |
| 2018 | 263 |
| 2017 | 248 |
| 2016 | 332 |
| 2015 | 329 |
| 2014 | 306 |
| 2013 | 288 |
| 2012 | 279 |
| 2011 | 236 |
| 2010 | 219 |